 Figure 2 Distribution of nFeature_RNA, nCount_RNA and percent.mt of mouse cardiac cells A: Distribution of nFeature_RNA and nCount_RNA for raw data of single-nucleus sequencing; B: Distribution of nFeature_RNA and nCount_RNA for raw data of single-nucleus sequencing after removed dead cells, cell debris and multicellular droplet; When nFeatures_RNA number is in the range of 200-2 829 gene numbers, the proportion of mitochondrial genes is zero; nFeature_RNA: The number of genes detected in each cell; nCount_RNA: Total number of molecules detected in cells; percent.mt: Proportion of mitochondrial related genes in the data
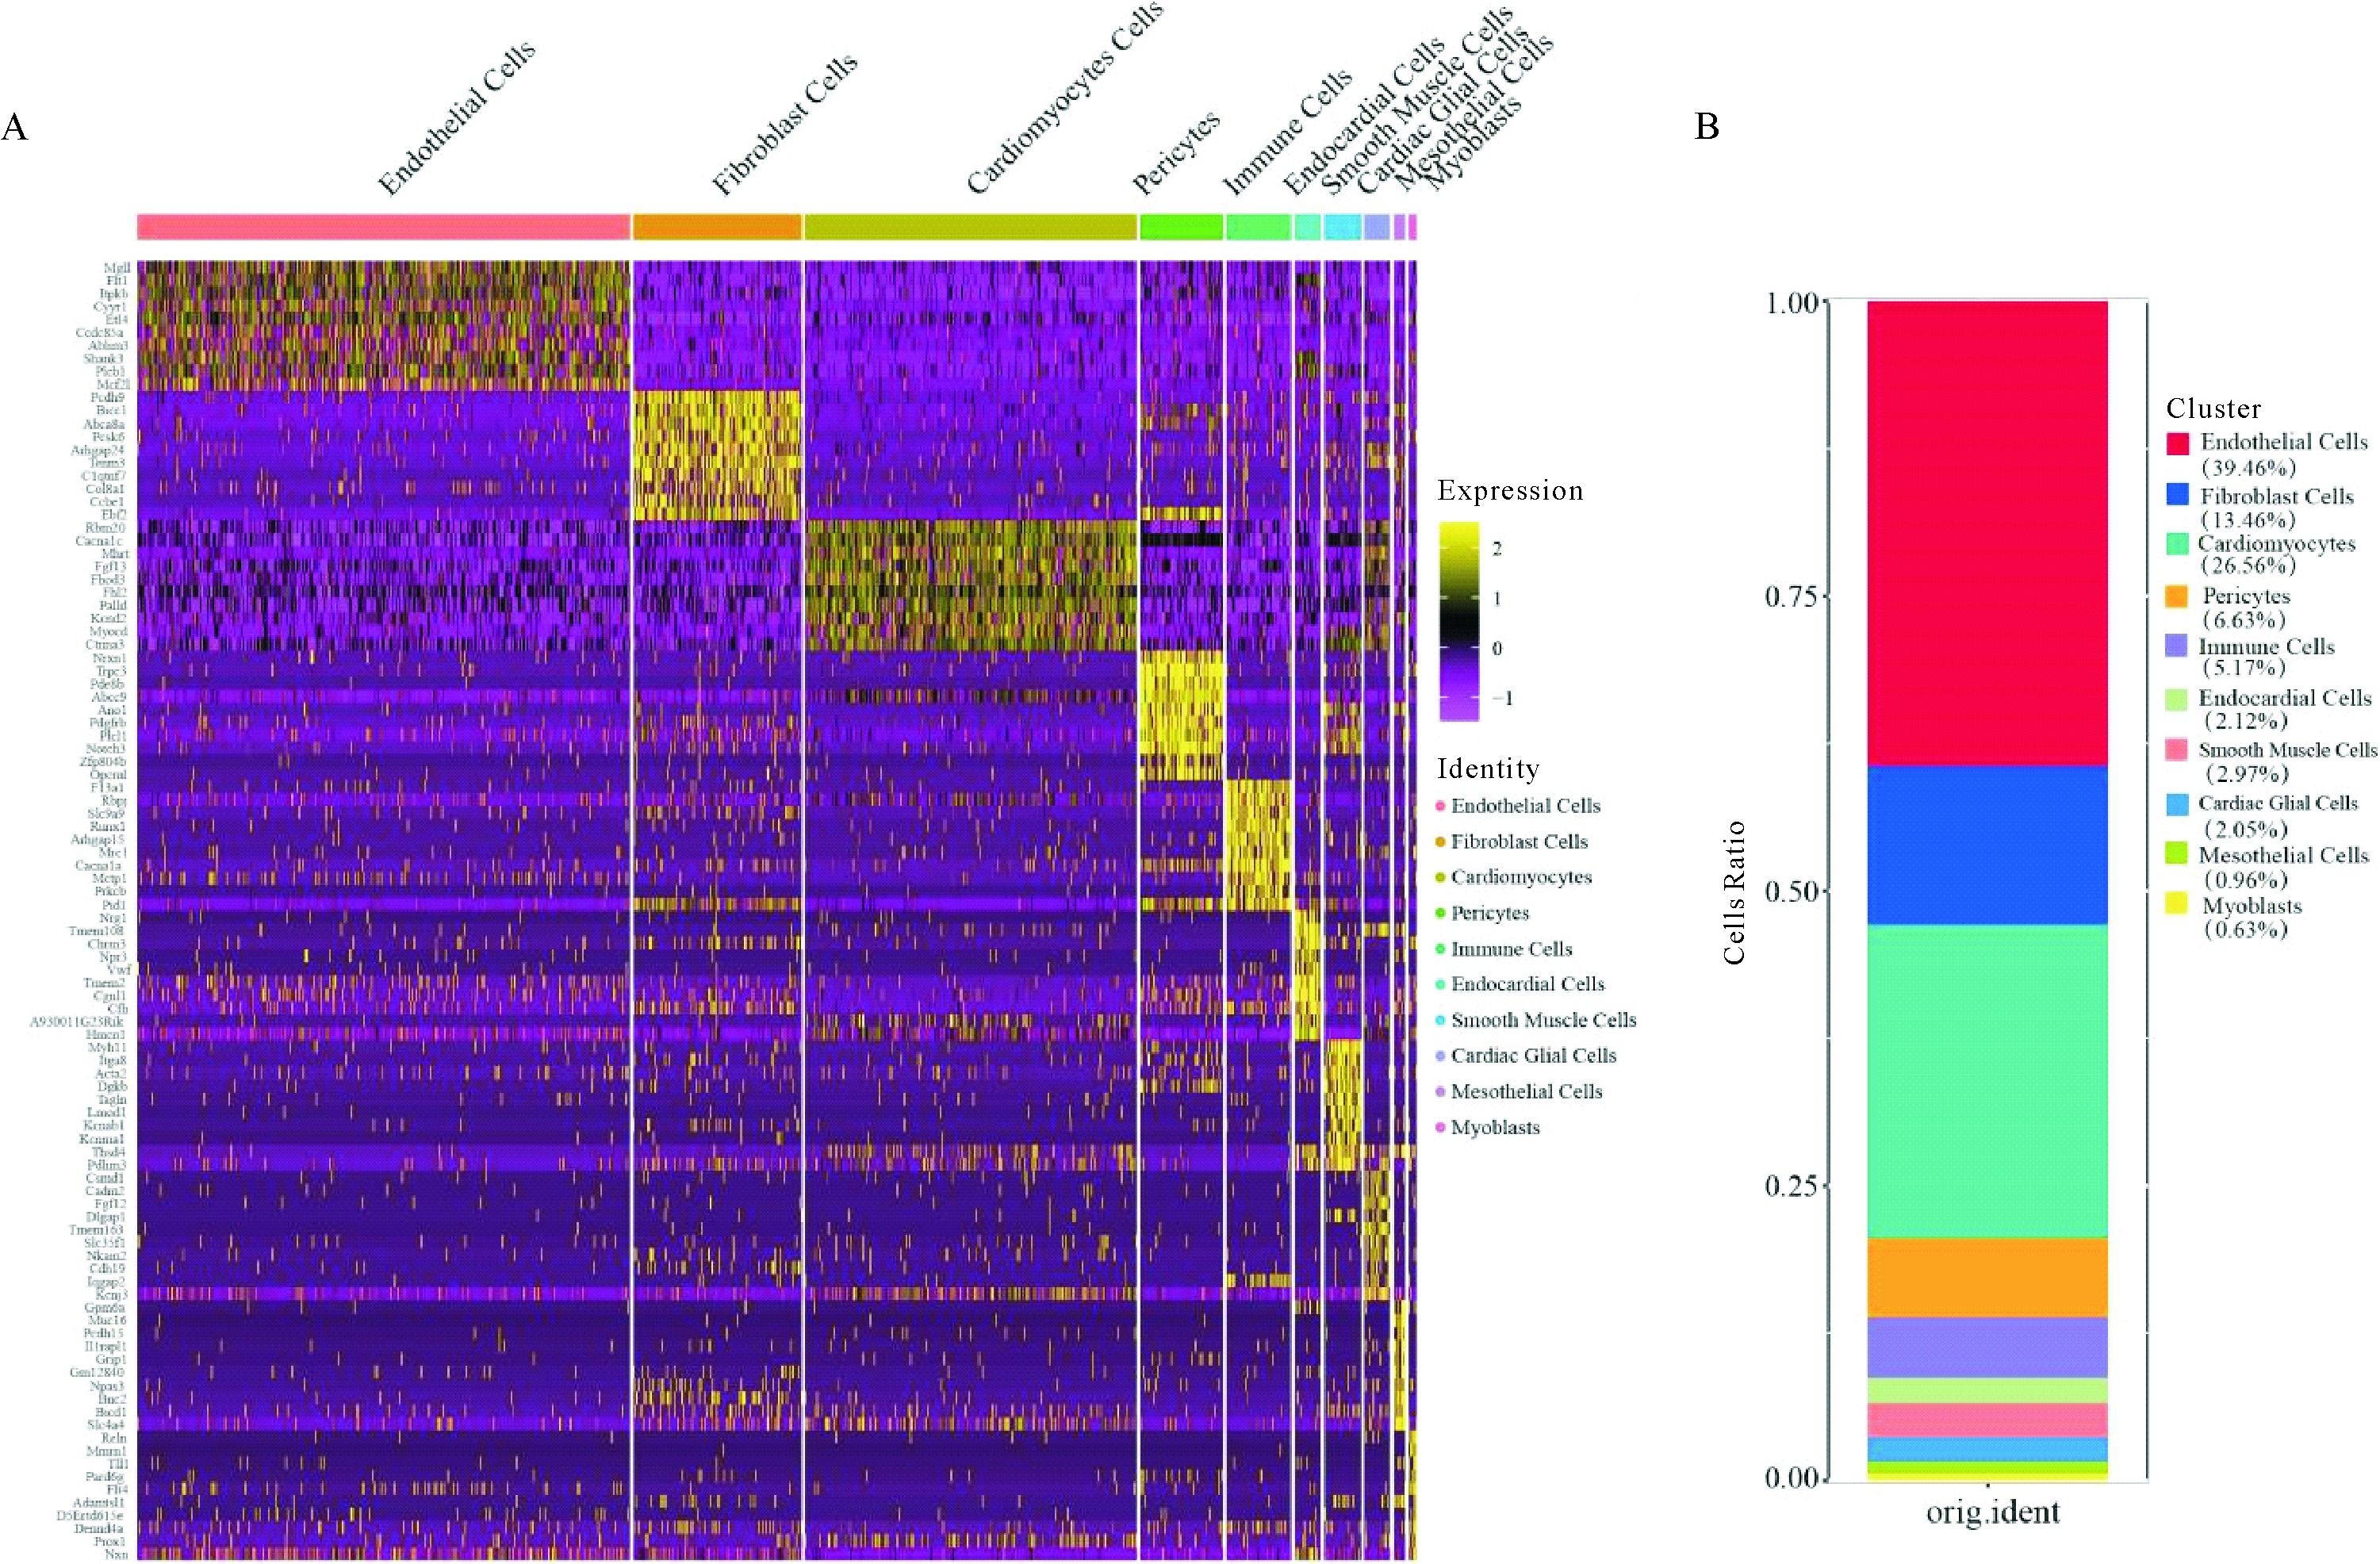
 Figure 16 The heat map of top ten differential expression genes in different cell populations and the proportion of different cell types in mouse heart A: The heat map of top ten differential expression genes in different cell populations of mouse heart; B: The proportion of different cell types of mouse heart