×
模态框(Modal)标题
在这里添加一些文本
Close
Close
Submit
Cancel
Confirm
×
模态框(Modal)标题
×
Toggle navigation
更多内容请点击
Home
Editorial Department
About Journal
Editorial Board
Instruction
Journal Online
Just Accepted
Current Issue
Archive
Most Read
Most Download
Most Cited
E-mail Alert
RSS
Subscription
Contact Us
中文
Figure/Table detail
Single-nucleus sequencing revealing the cell populations and proportion in adult mouse heart
LIANG Chunbao, LI Lilin, CAI Dongqing
Journal of Jinan University Natural Science & Medicine Edition
, 2023, 44(
2
): 124-136. DOI:
10.11778/j.jdxb.20220246
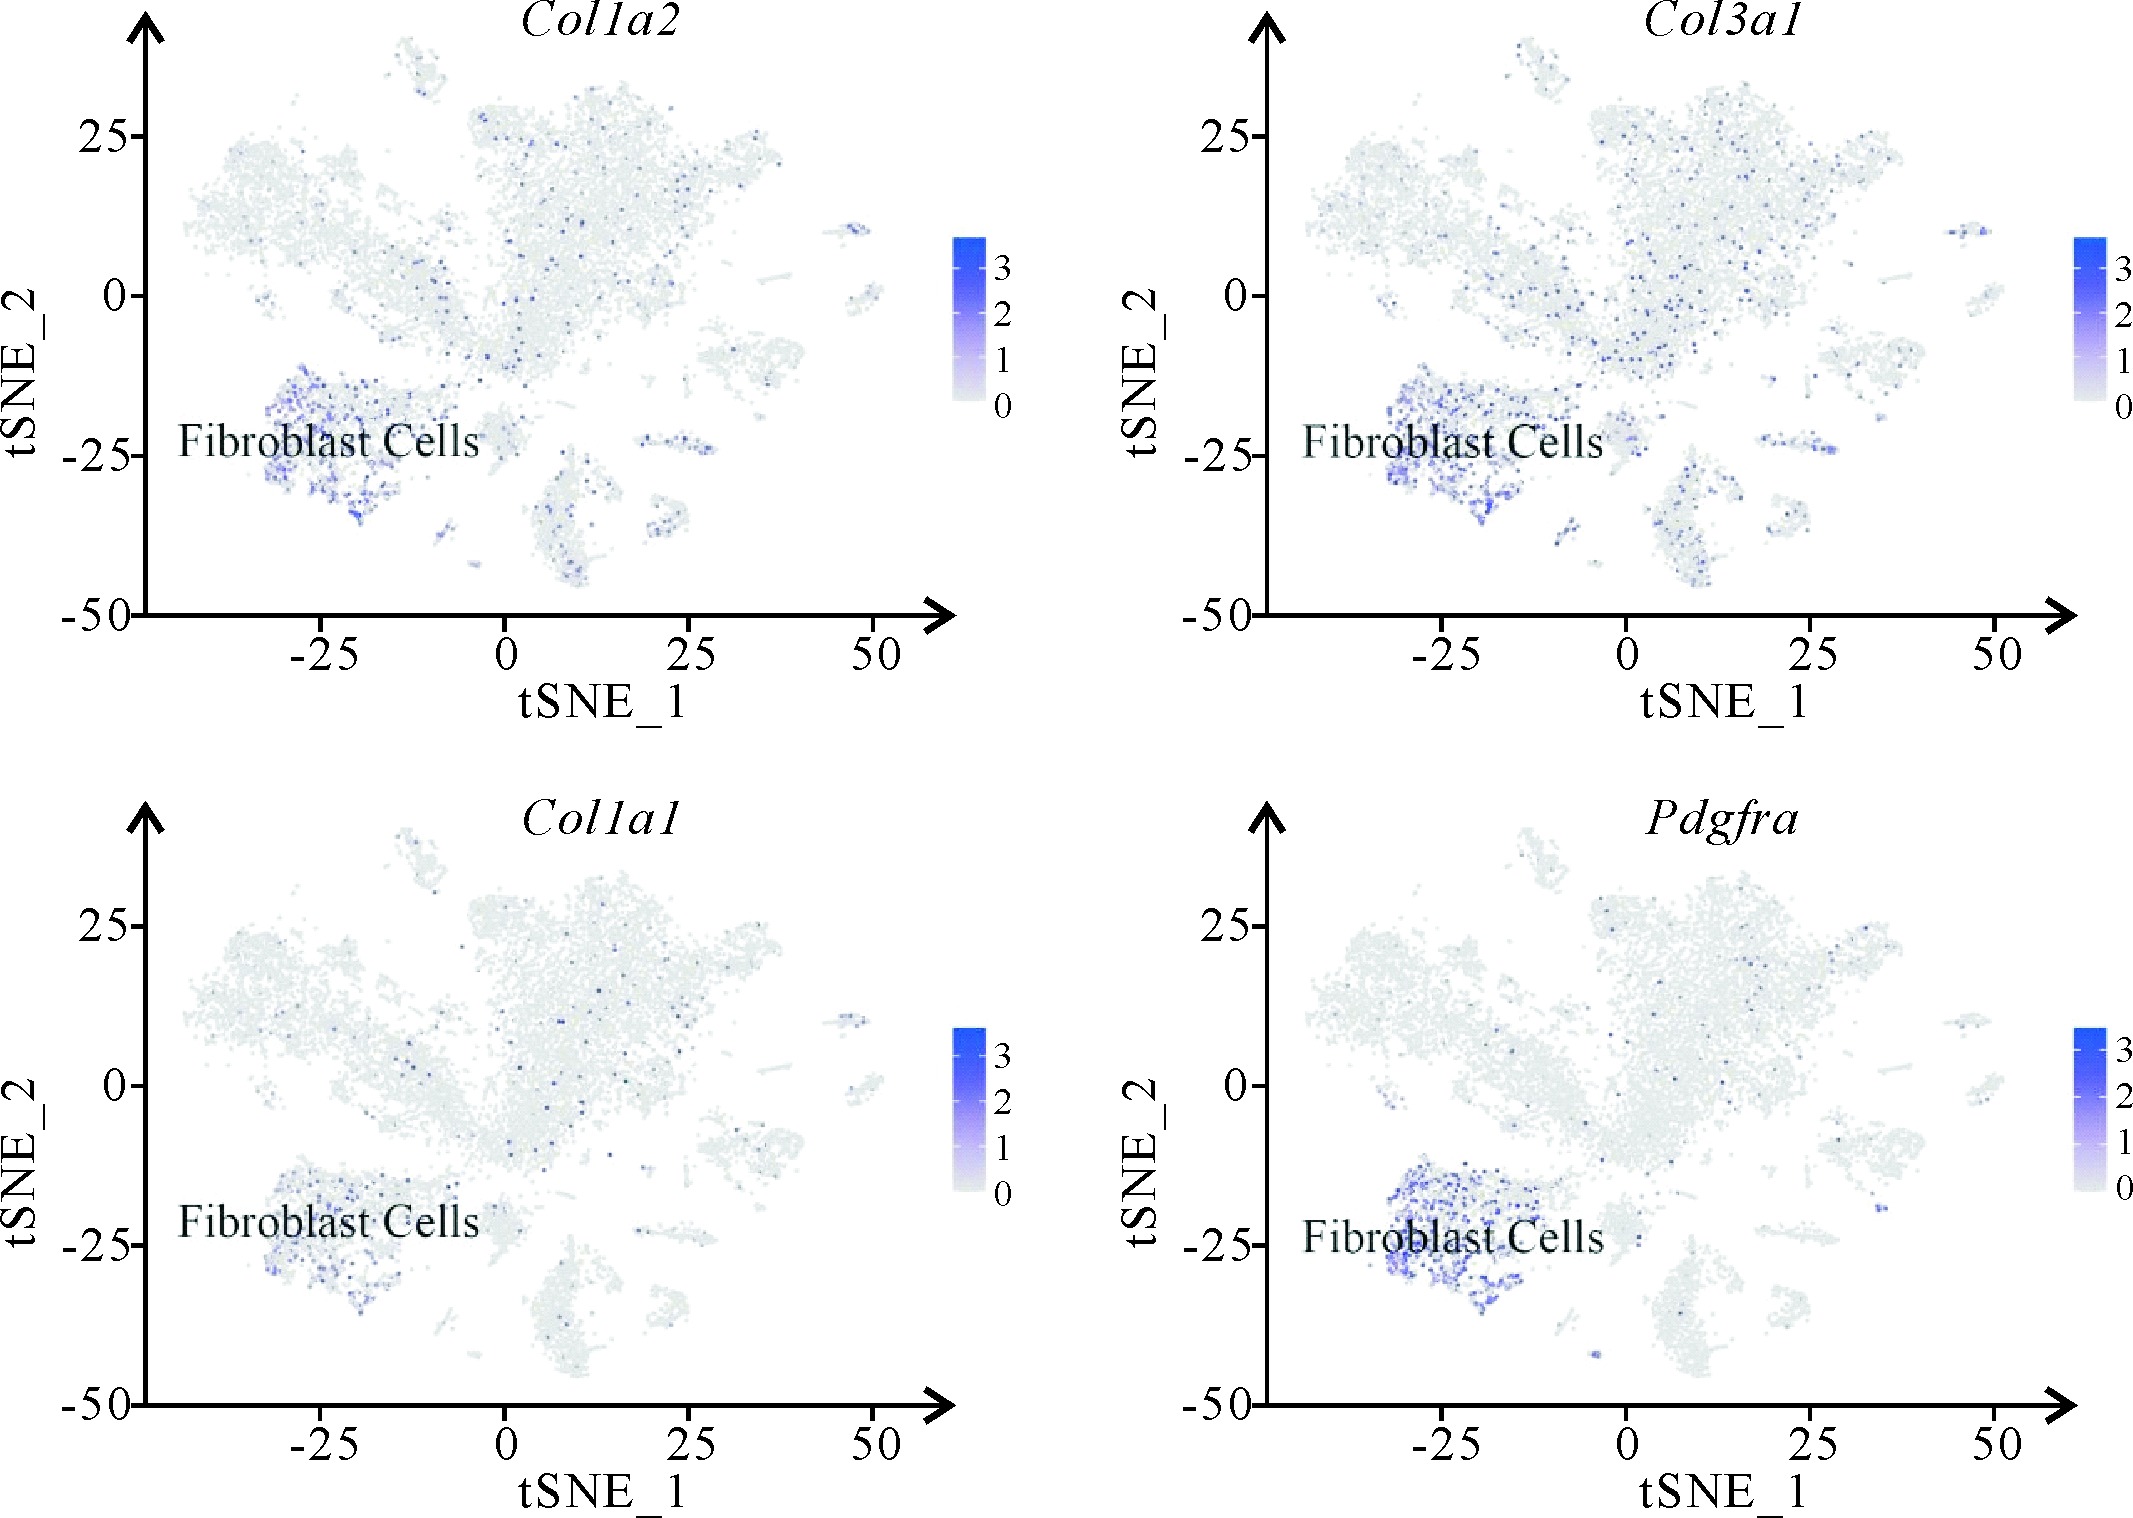
Figure 8
Marker genes of fibroblasts displayed by tSNE clustering
Other figure/table from this article
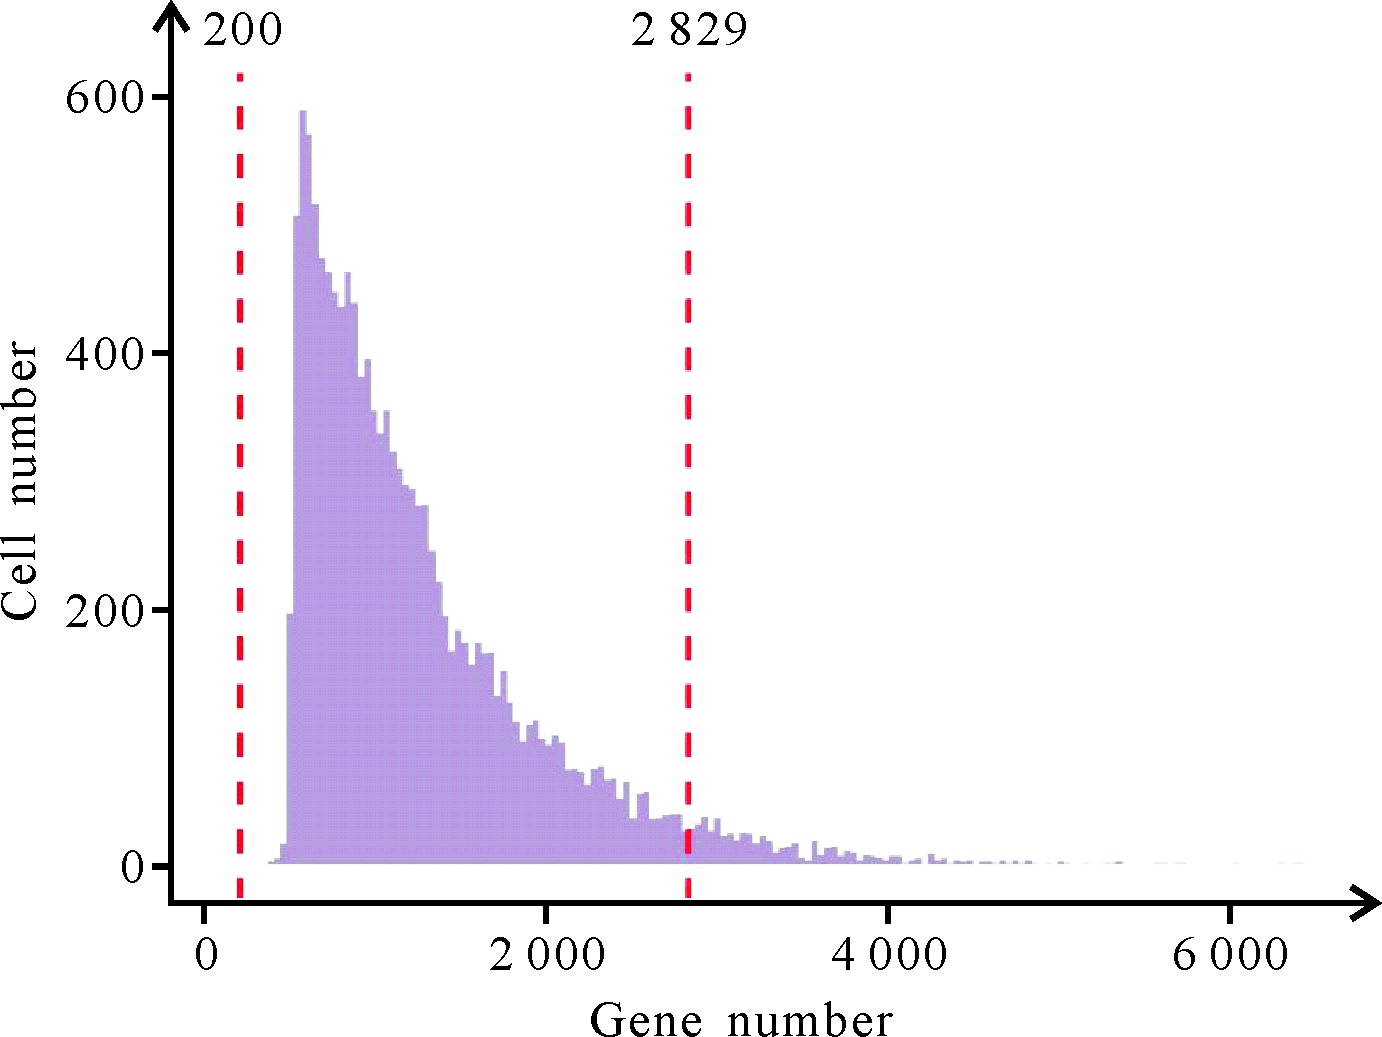
Figure 1
Distribution of the gene number detected in single nucleus
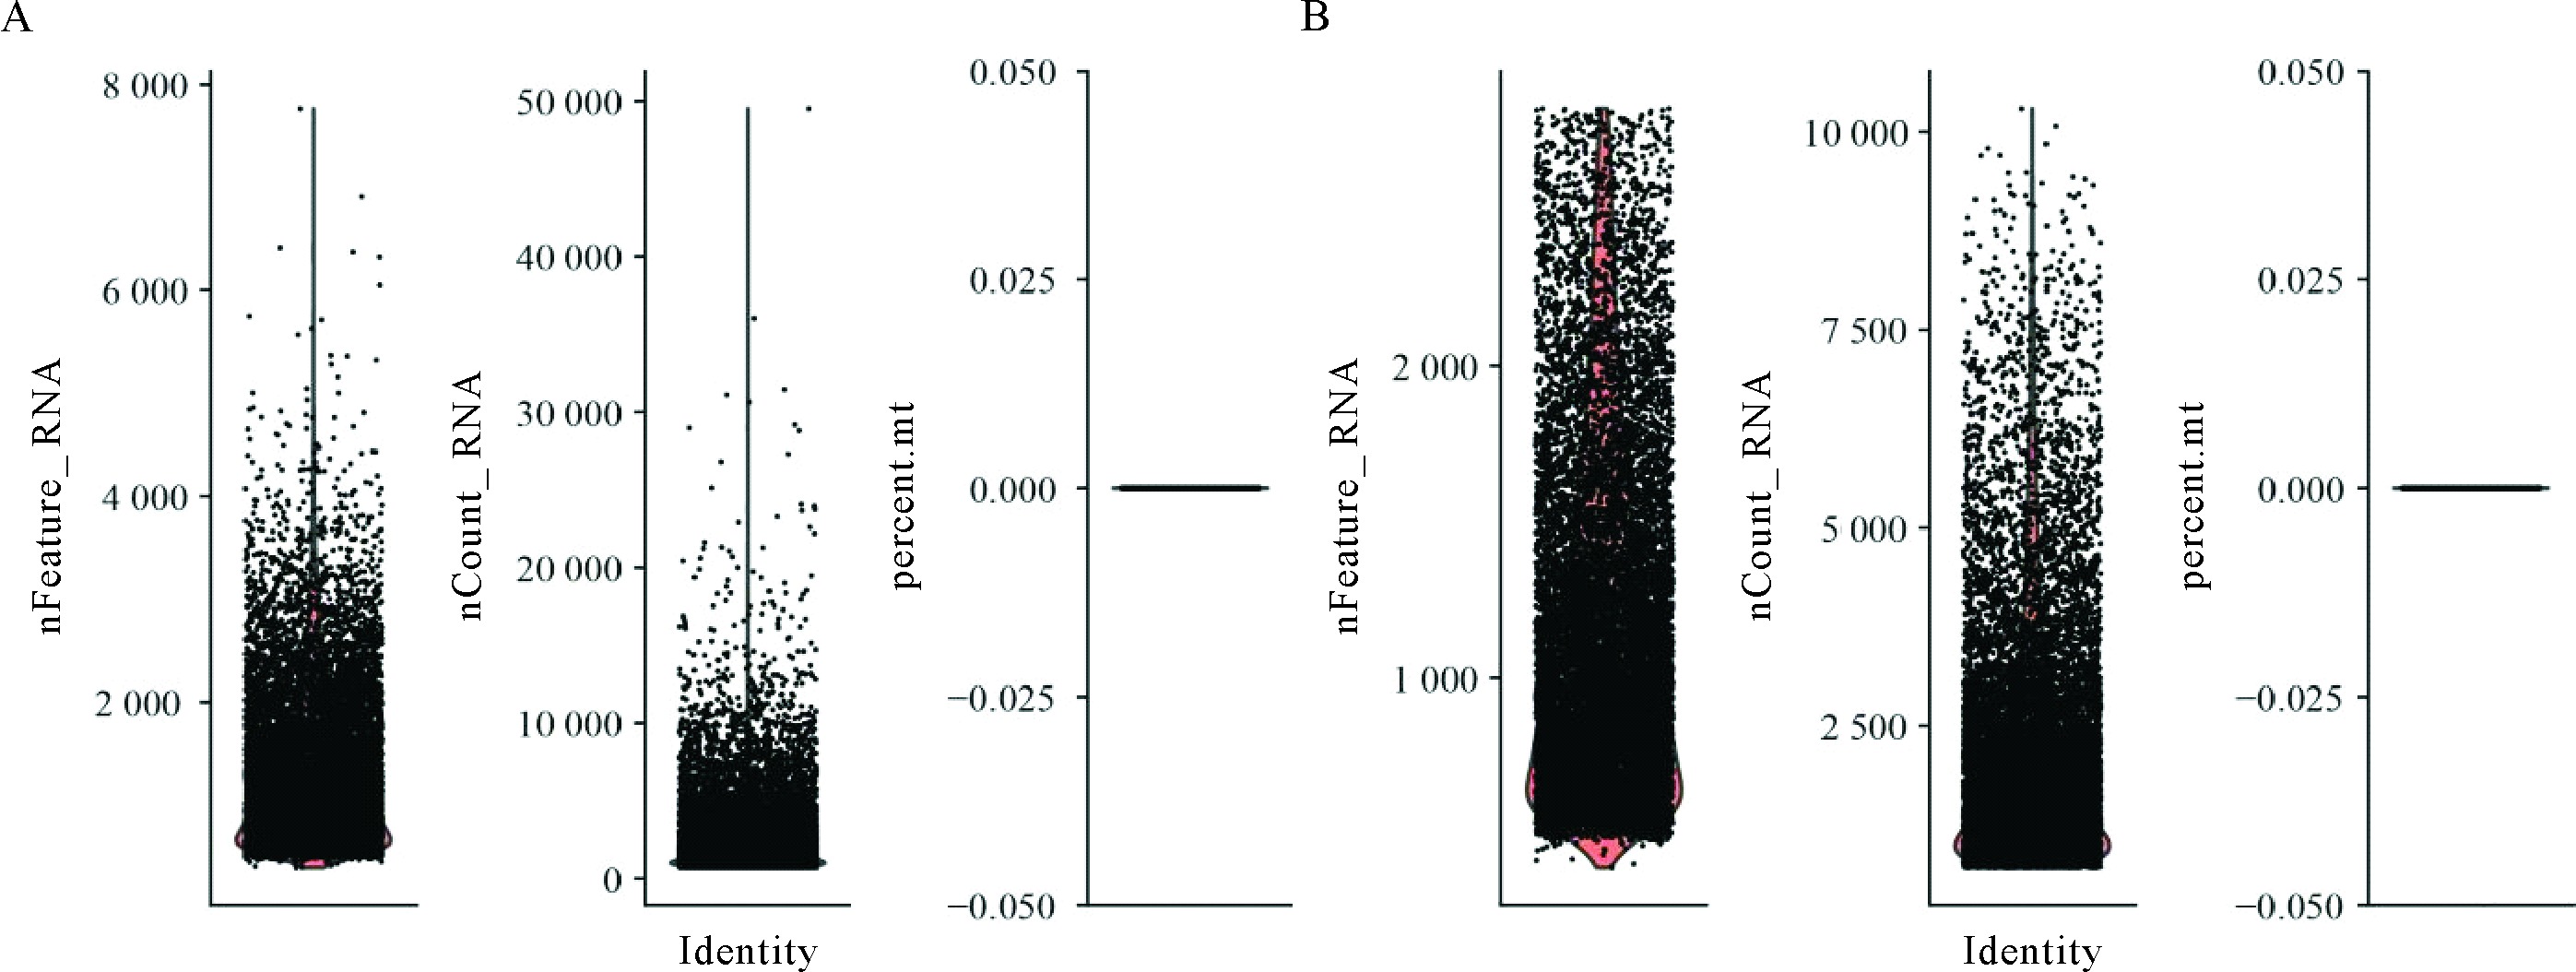
Figure 2
Distribution of nFeature_RNA, nCount_RNA and percent.mt of mouse cardiac cells
A: Distribution of nFeature_RNA and nCount_RNA for raw data of single-nucleus sequencing; B: Distribution of nFeature_RNA and nCount_RNA for raw data of single-nucleus sequencing after removed dead cells, cell debris and multicellular droplet; When nFeatures_RNA number is in the range of 200-2 829 gene numbers, the proportion of mitochondrial genes is zero; nFeature_RNA: The number of genes detected in each cell; nCount_RNA: Total number of molecules detected in cells; percent.mt: Proportion of mitochondrial related genes in the data
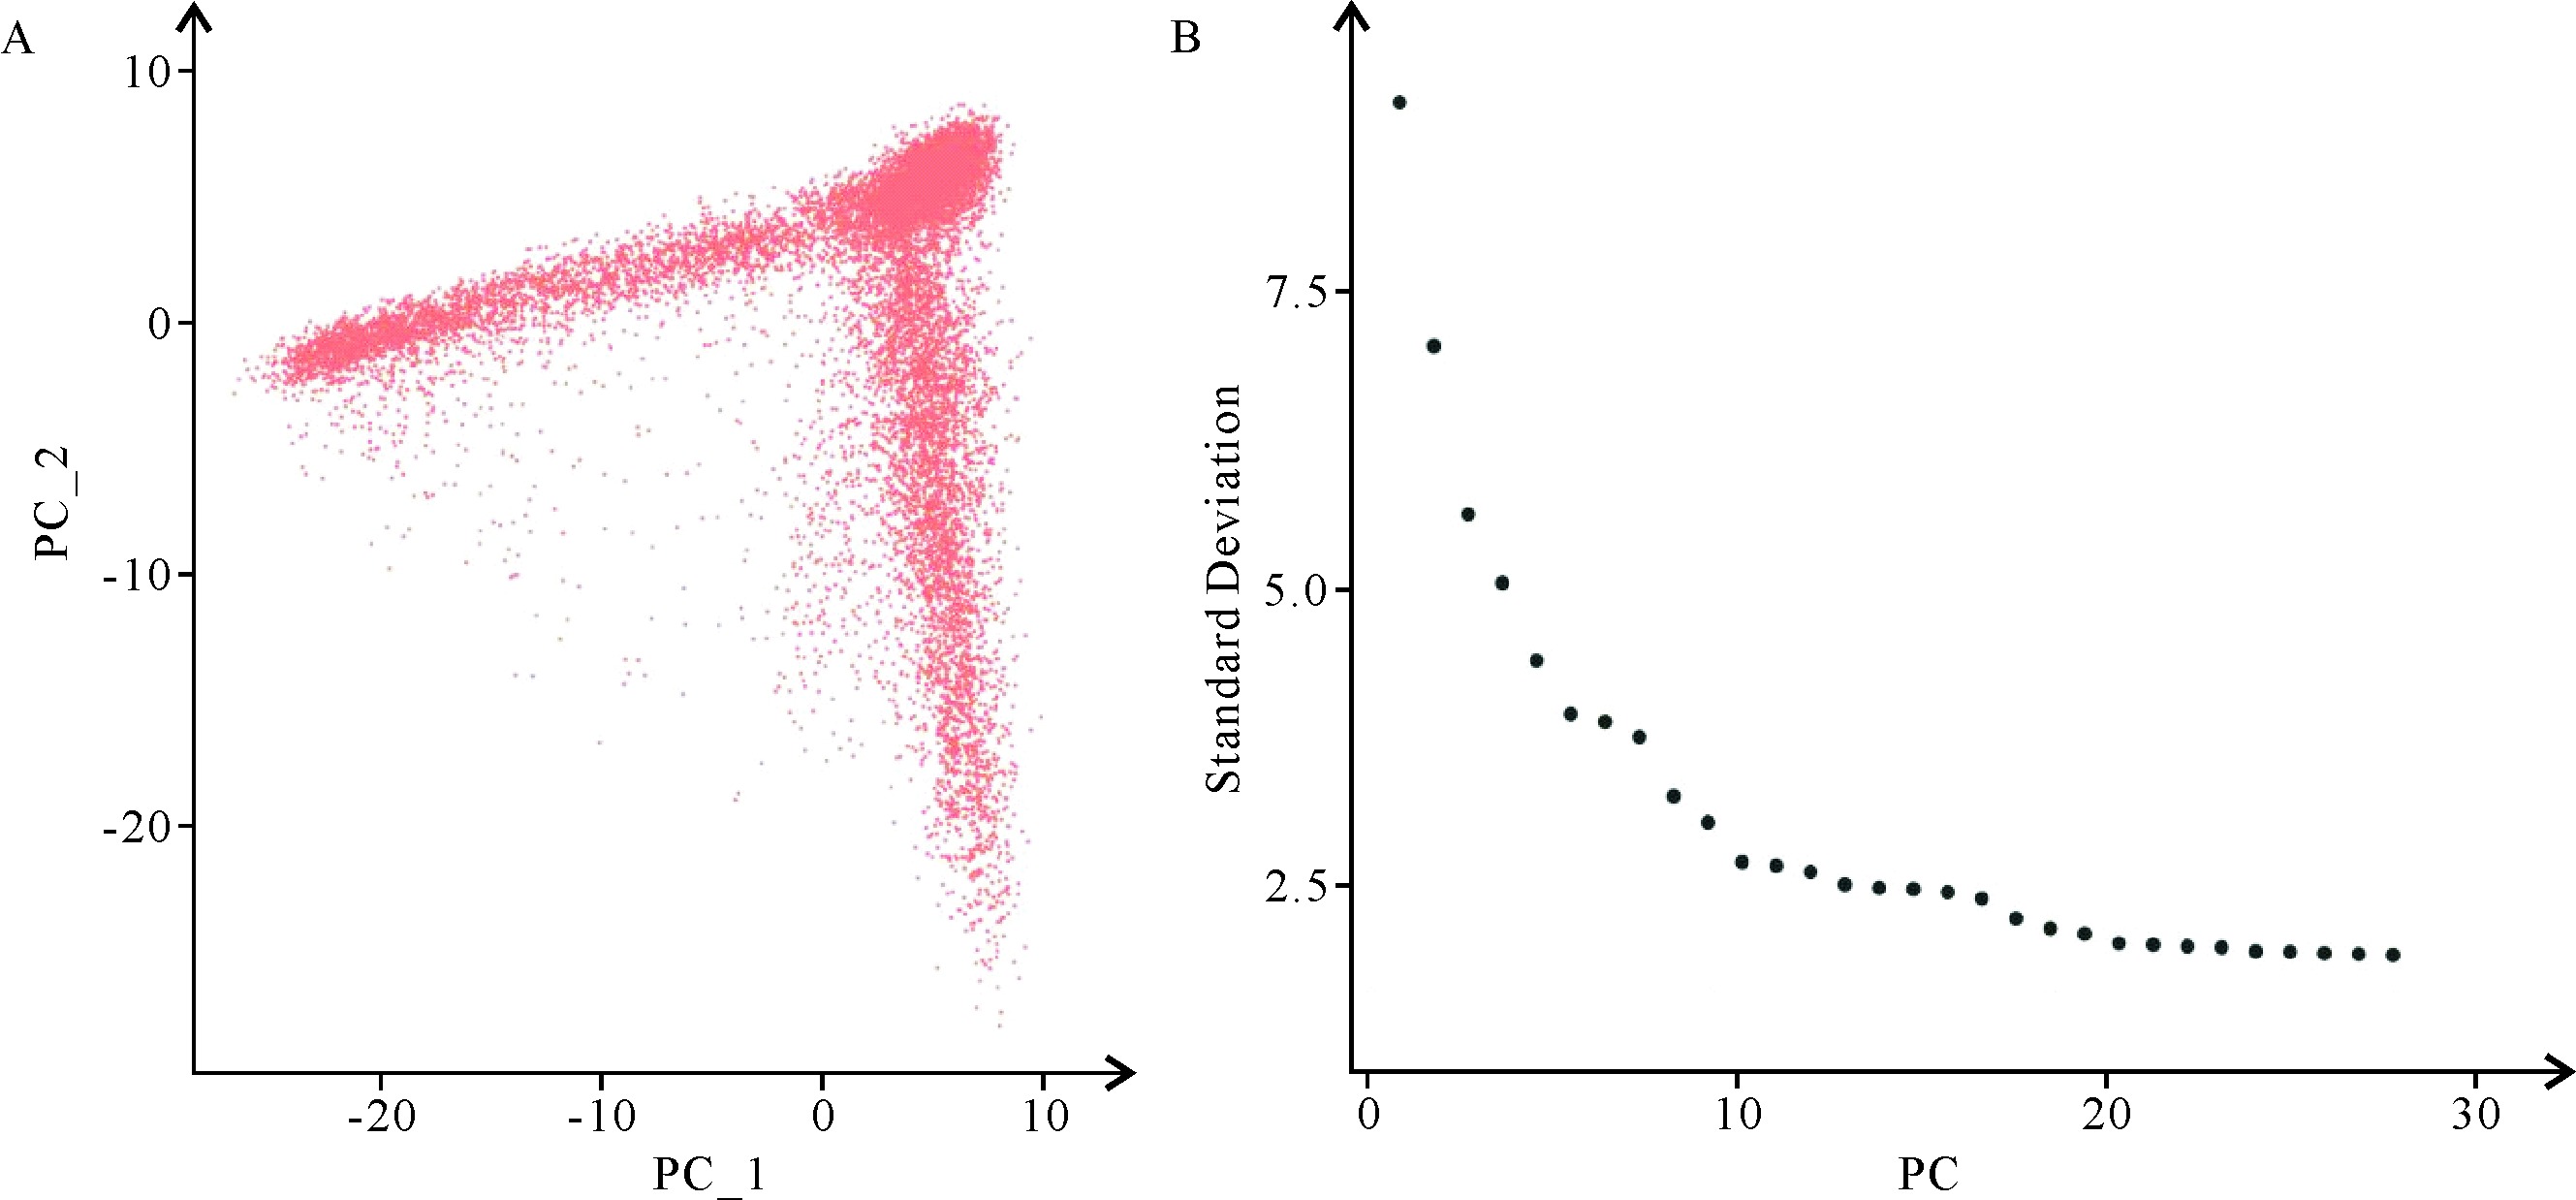
Figure 3
Principal component analysis of mouse heart by single-nucleus sequencing
A: Principal Component Analysis;B: The top 30 principal components in ElbowPlot
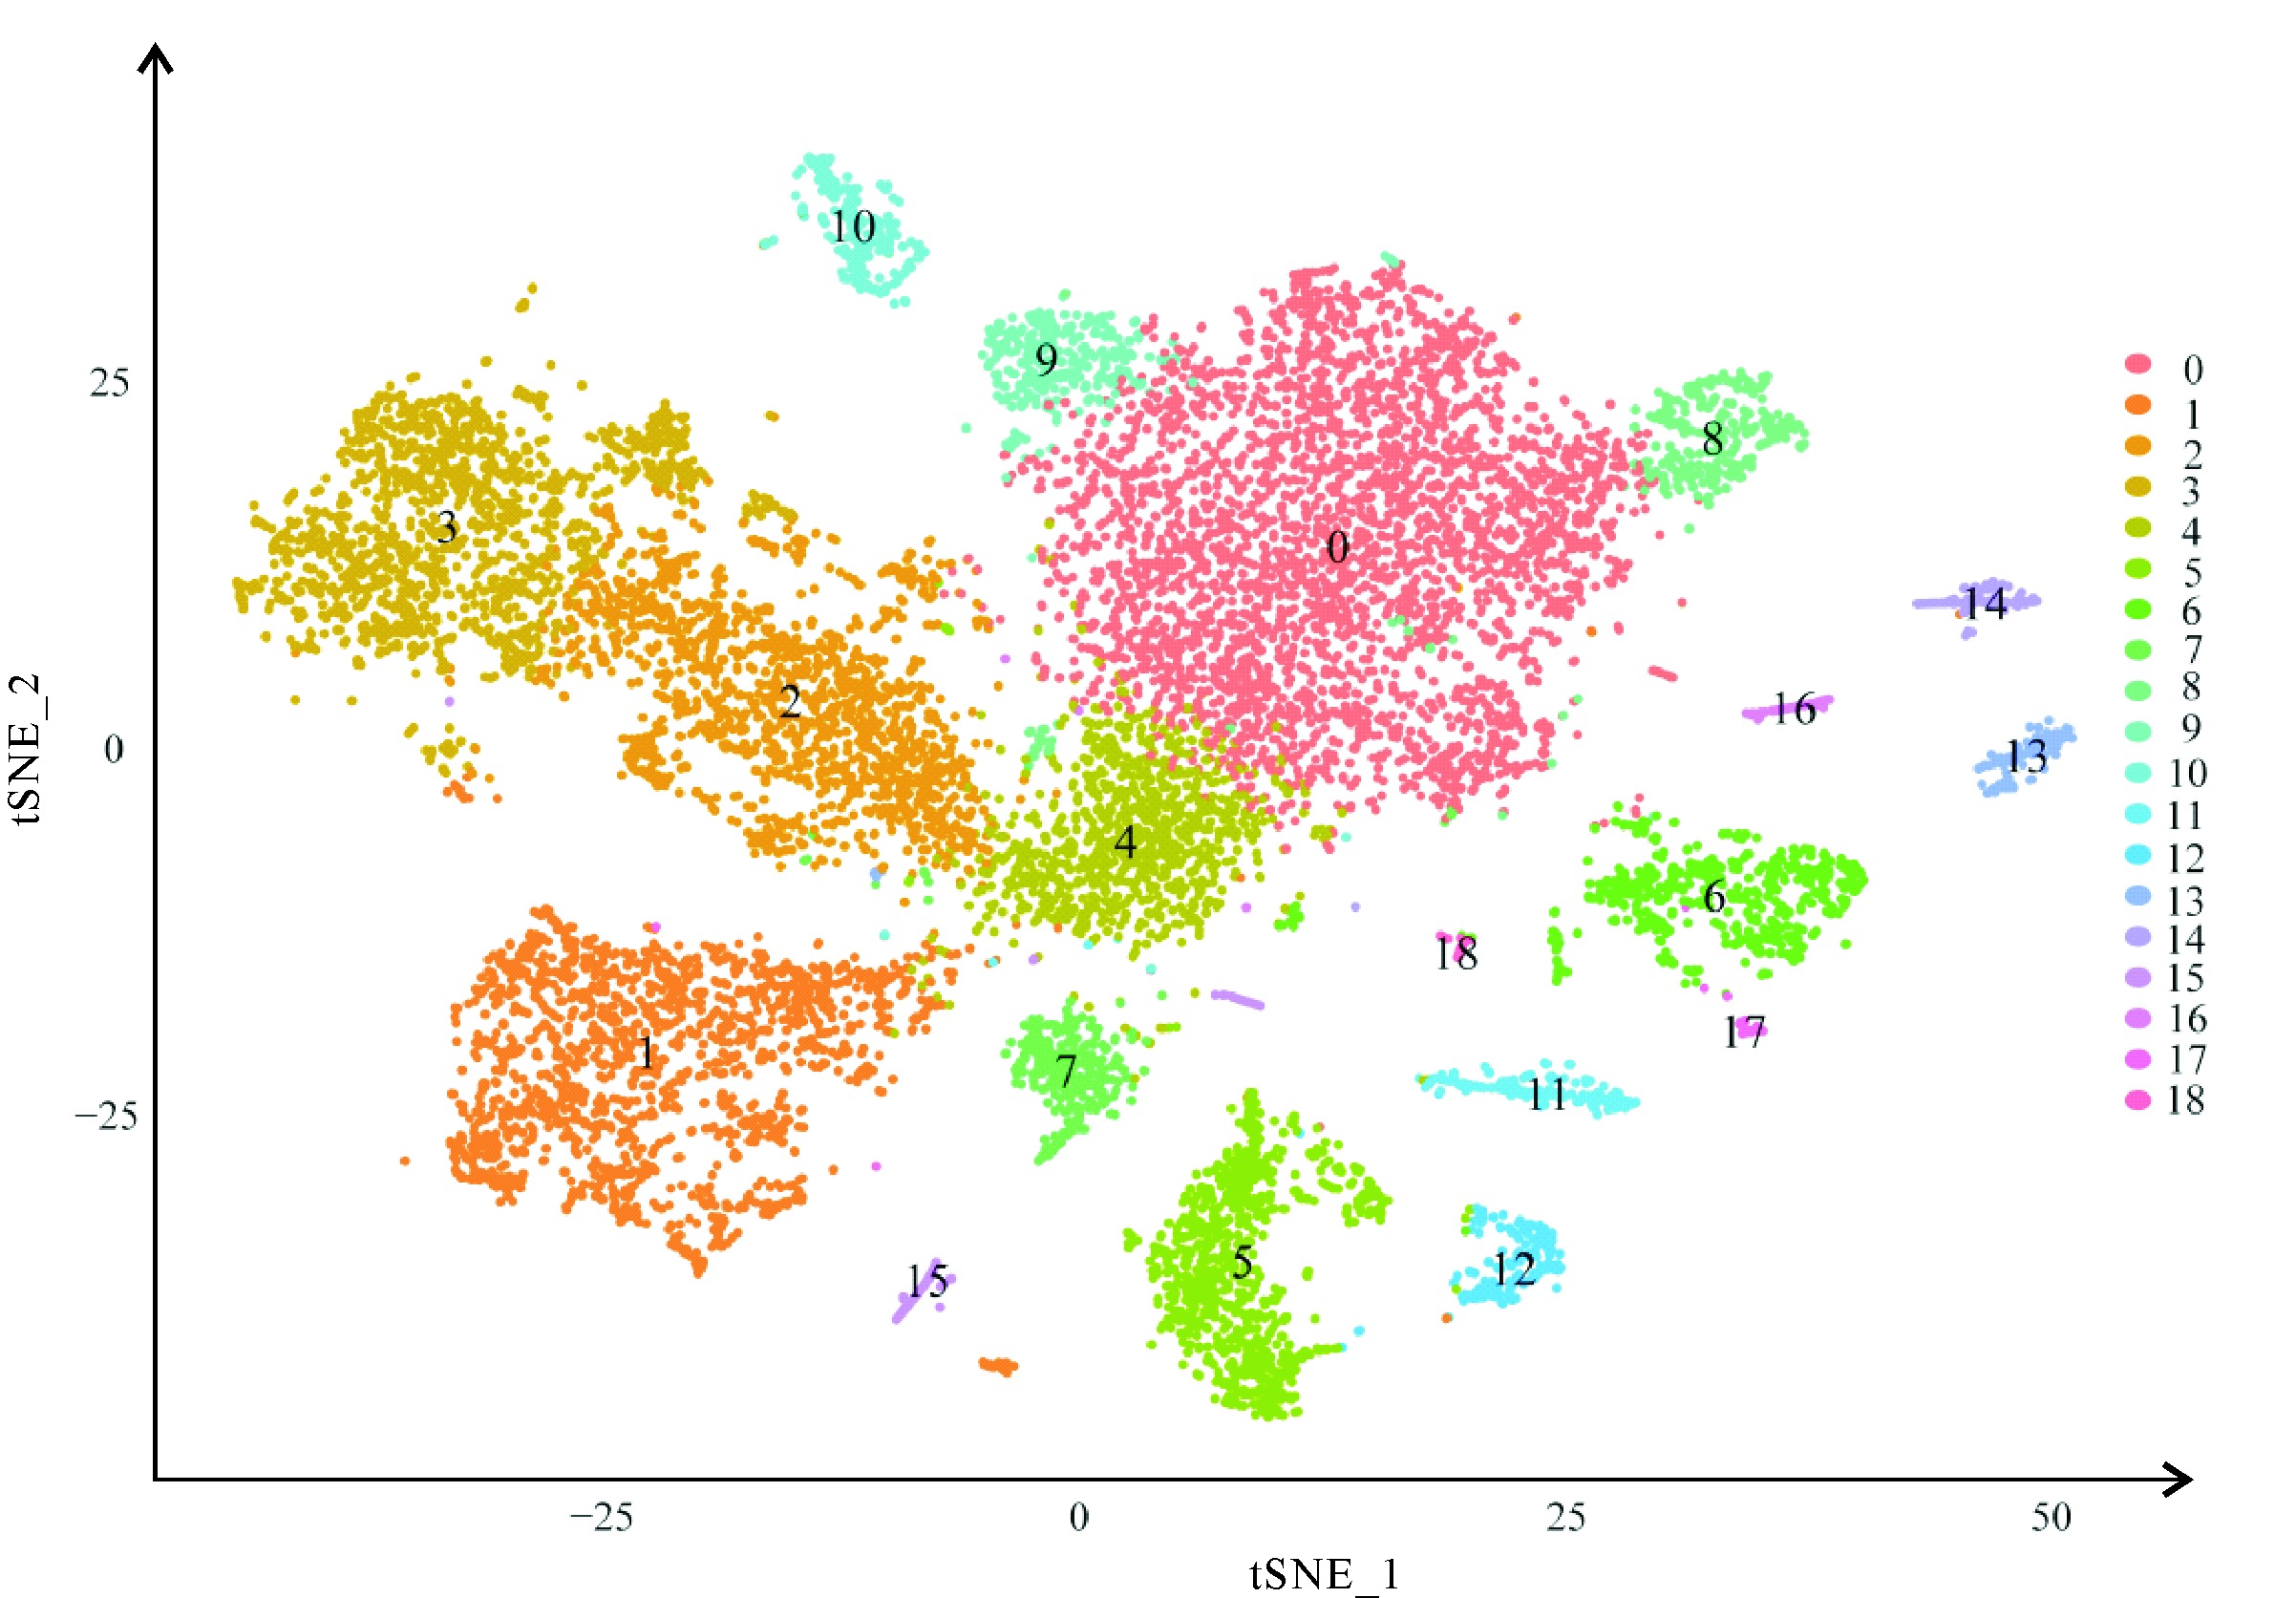
Figure 4
tSNE clustering of mouse cardiac cells
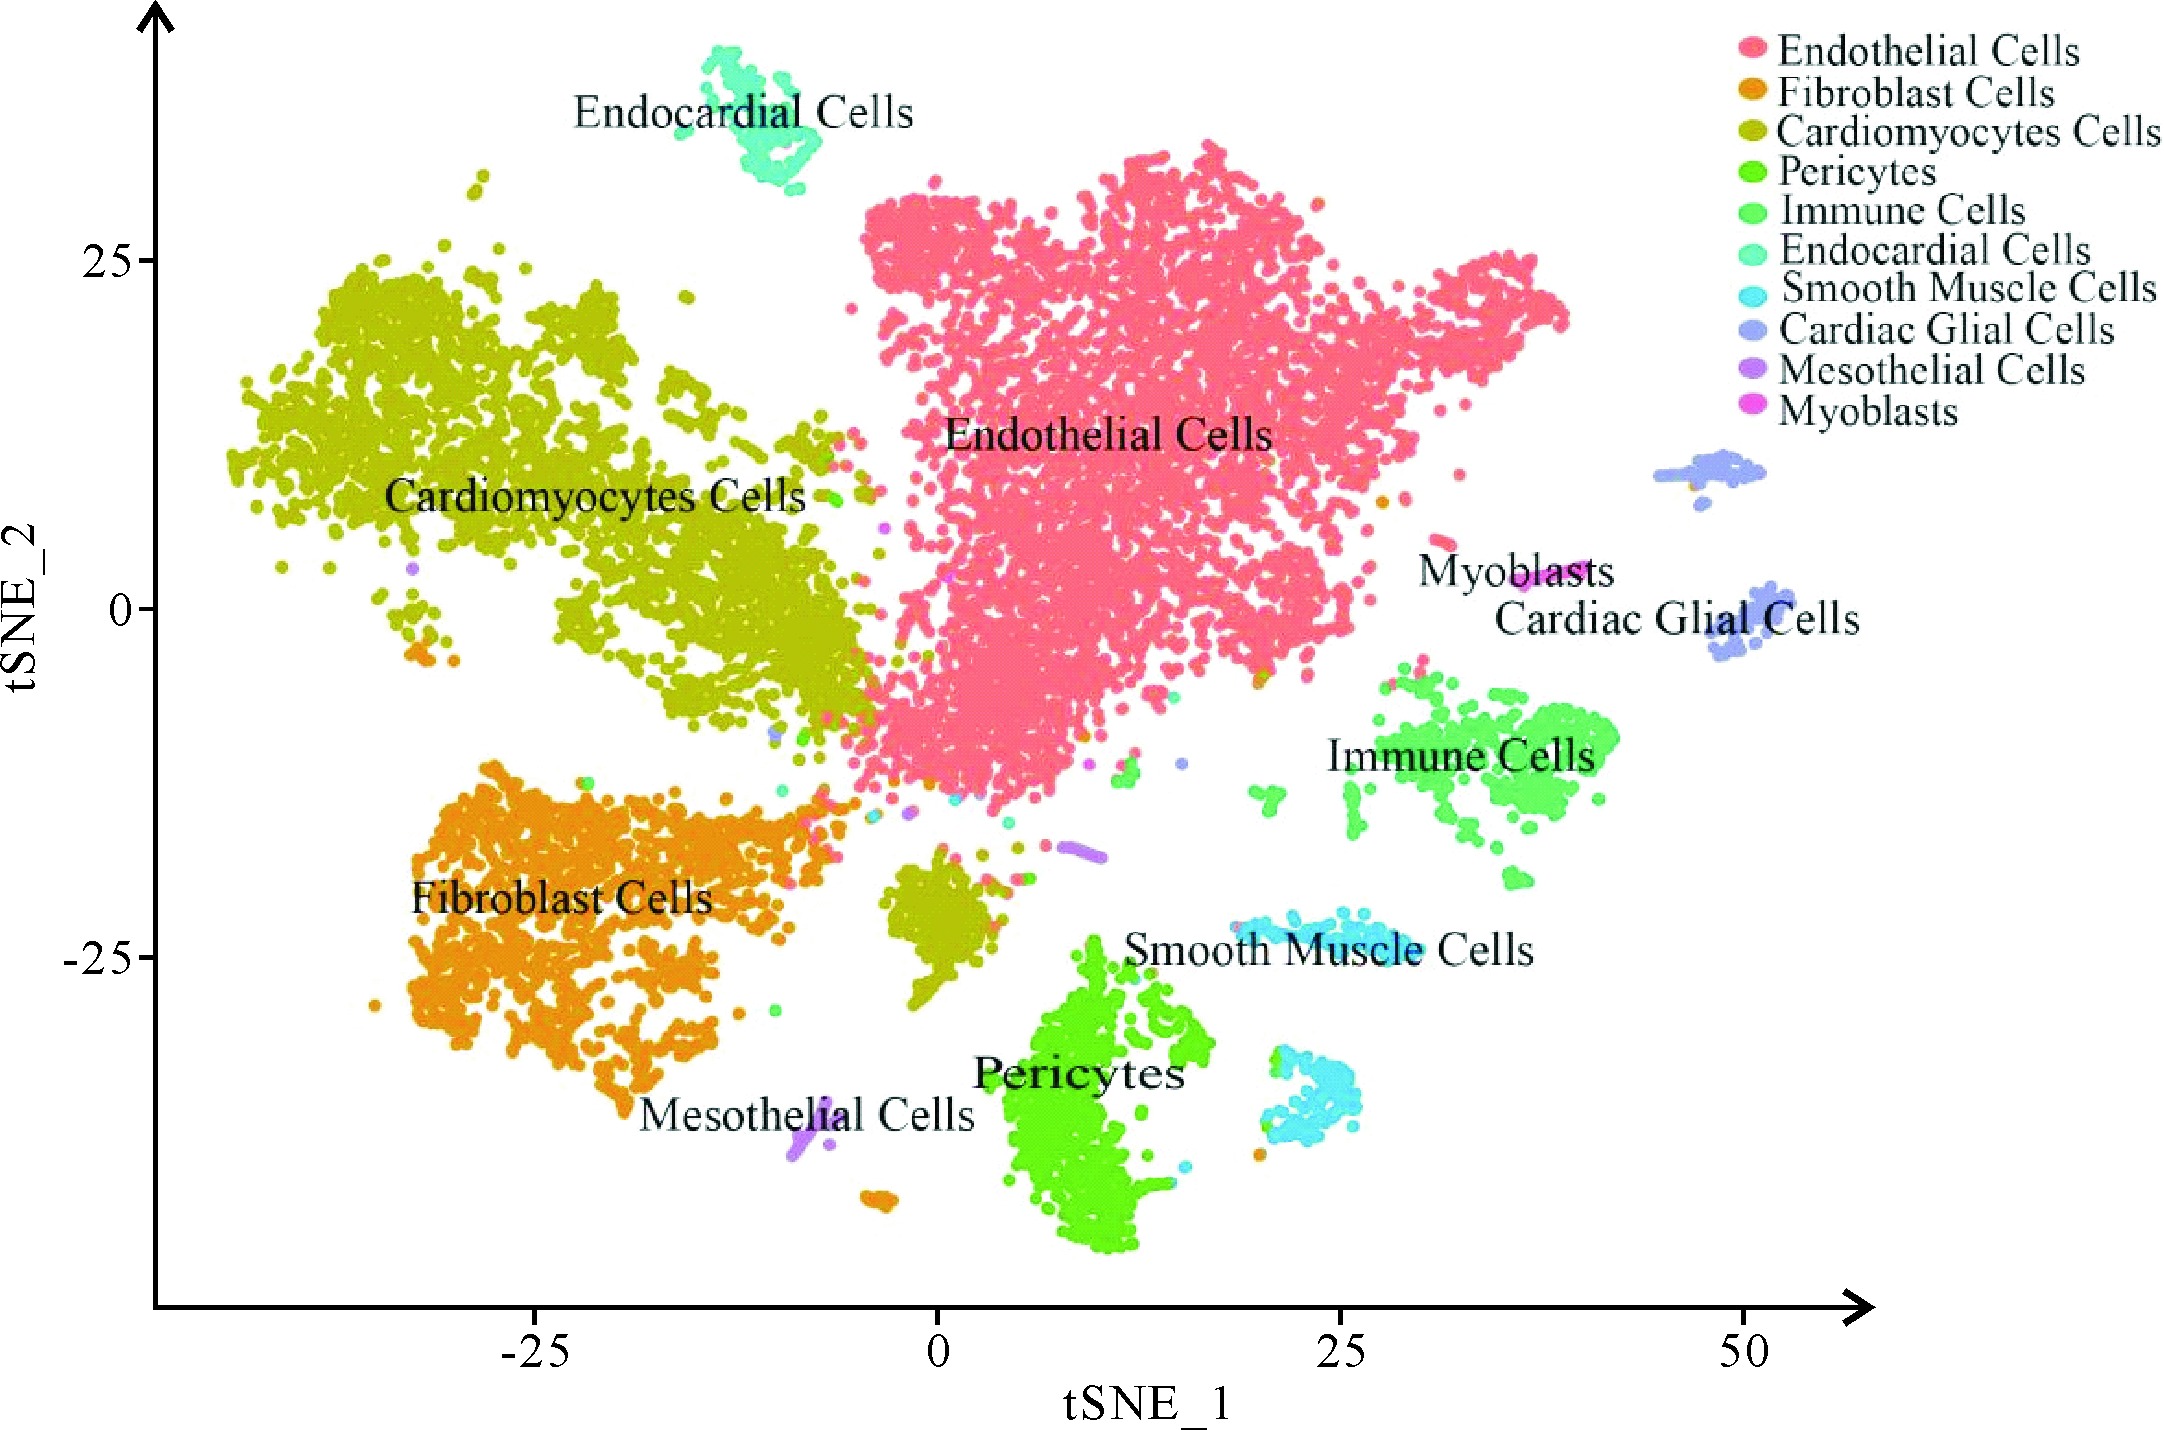
Figure 5
Annotation of cellular properties of tSNE clustering of mouse cardiac cells
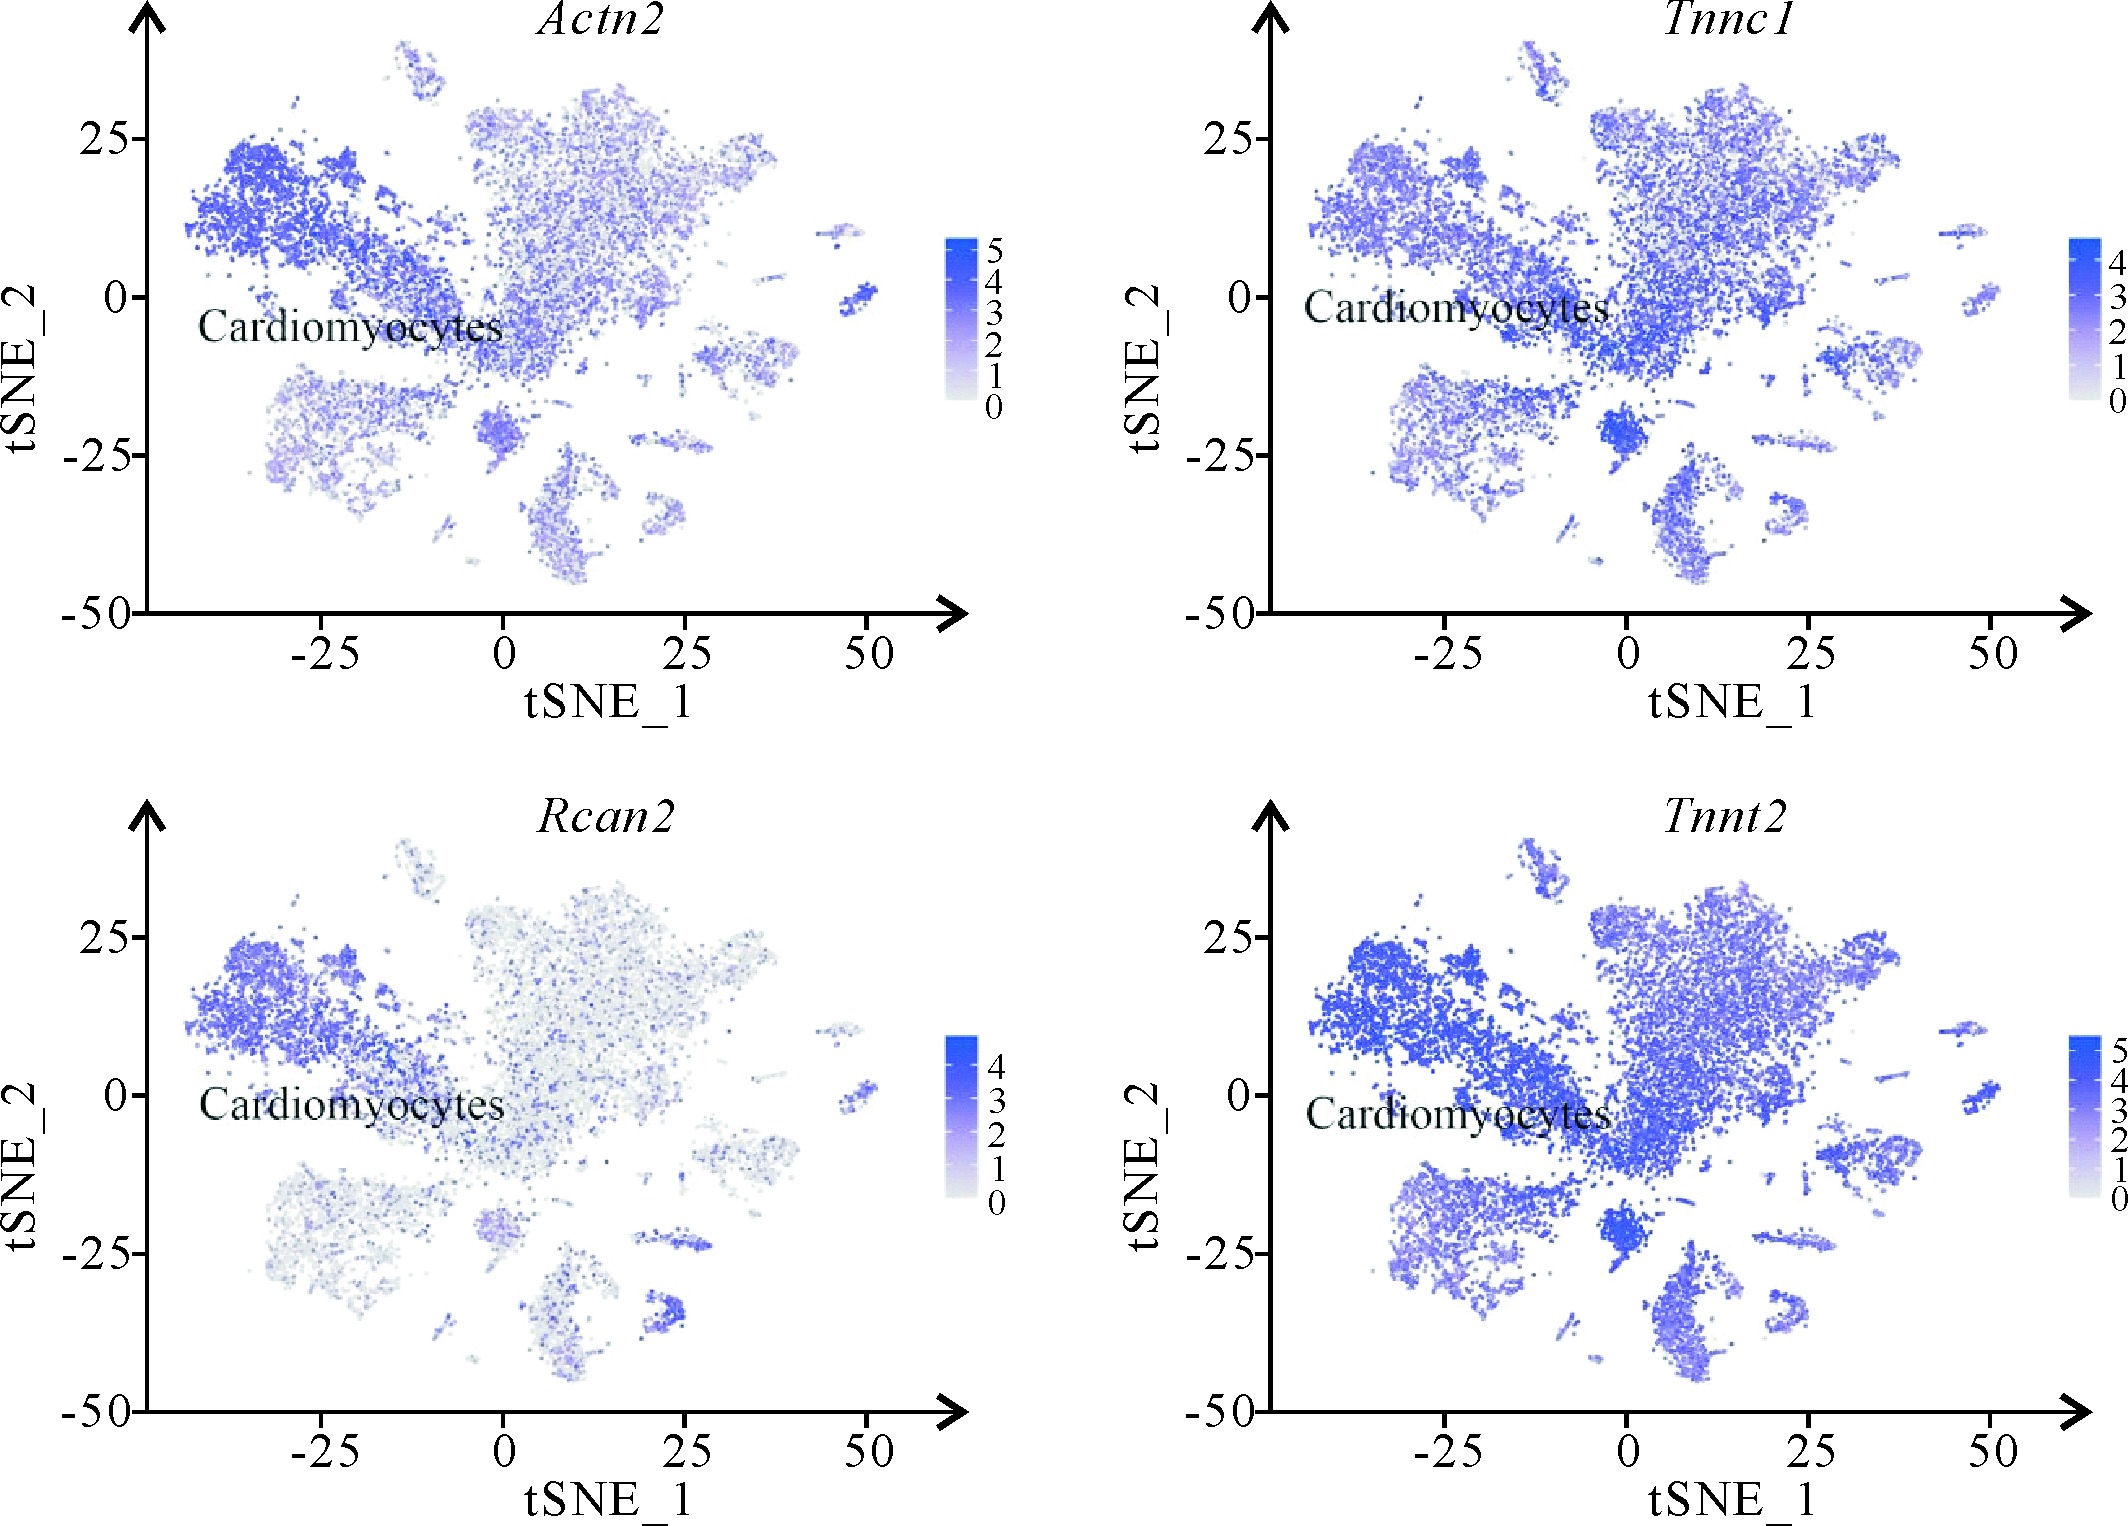
Figure 6
Marker genes of cardiomyoctes displayed by tSNE clustering
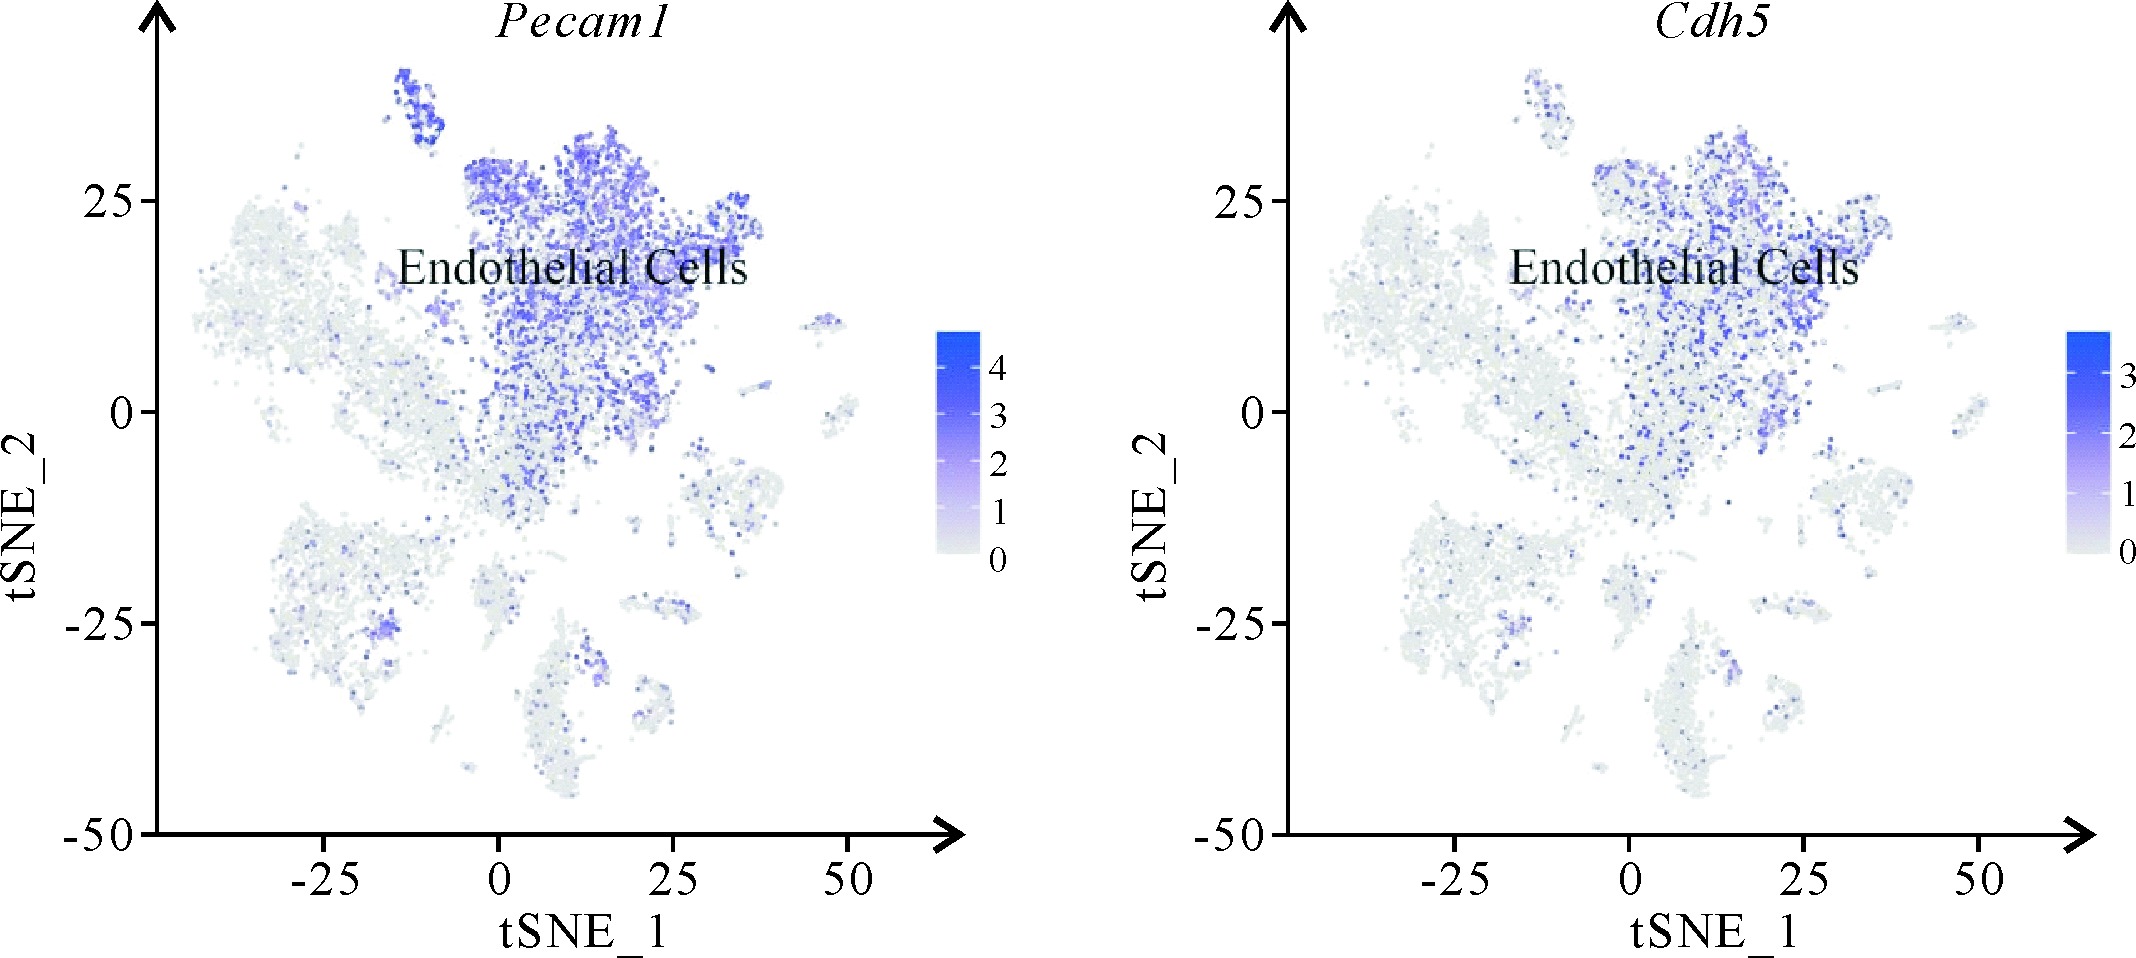
Figure 7
Marker genes of endothelial cells displayed by tSNE clustering
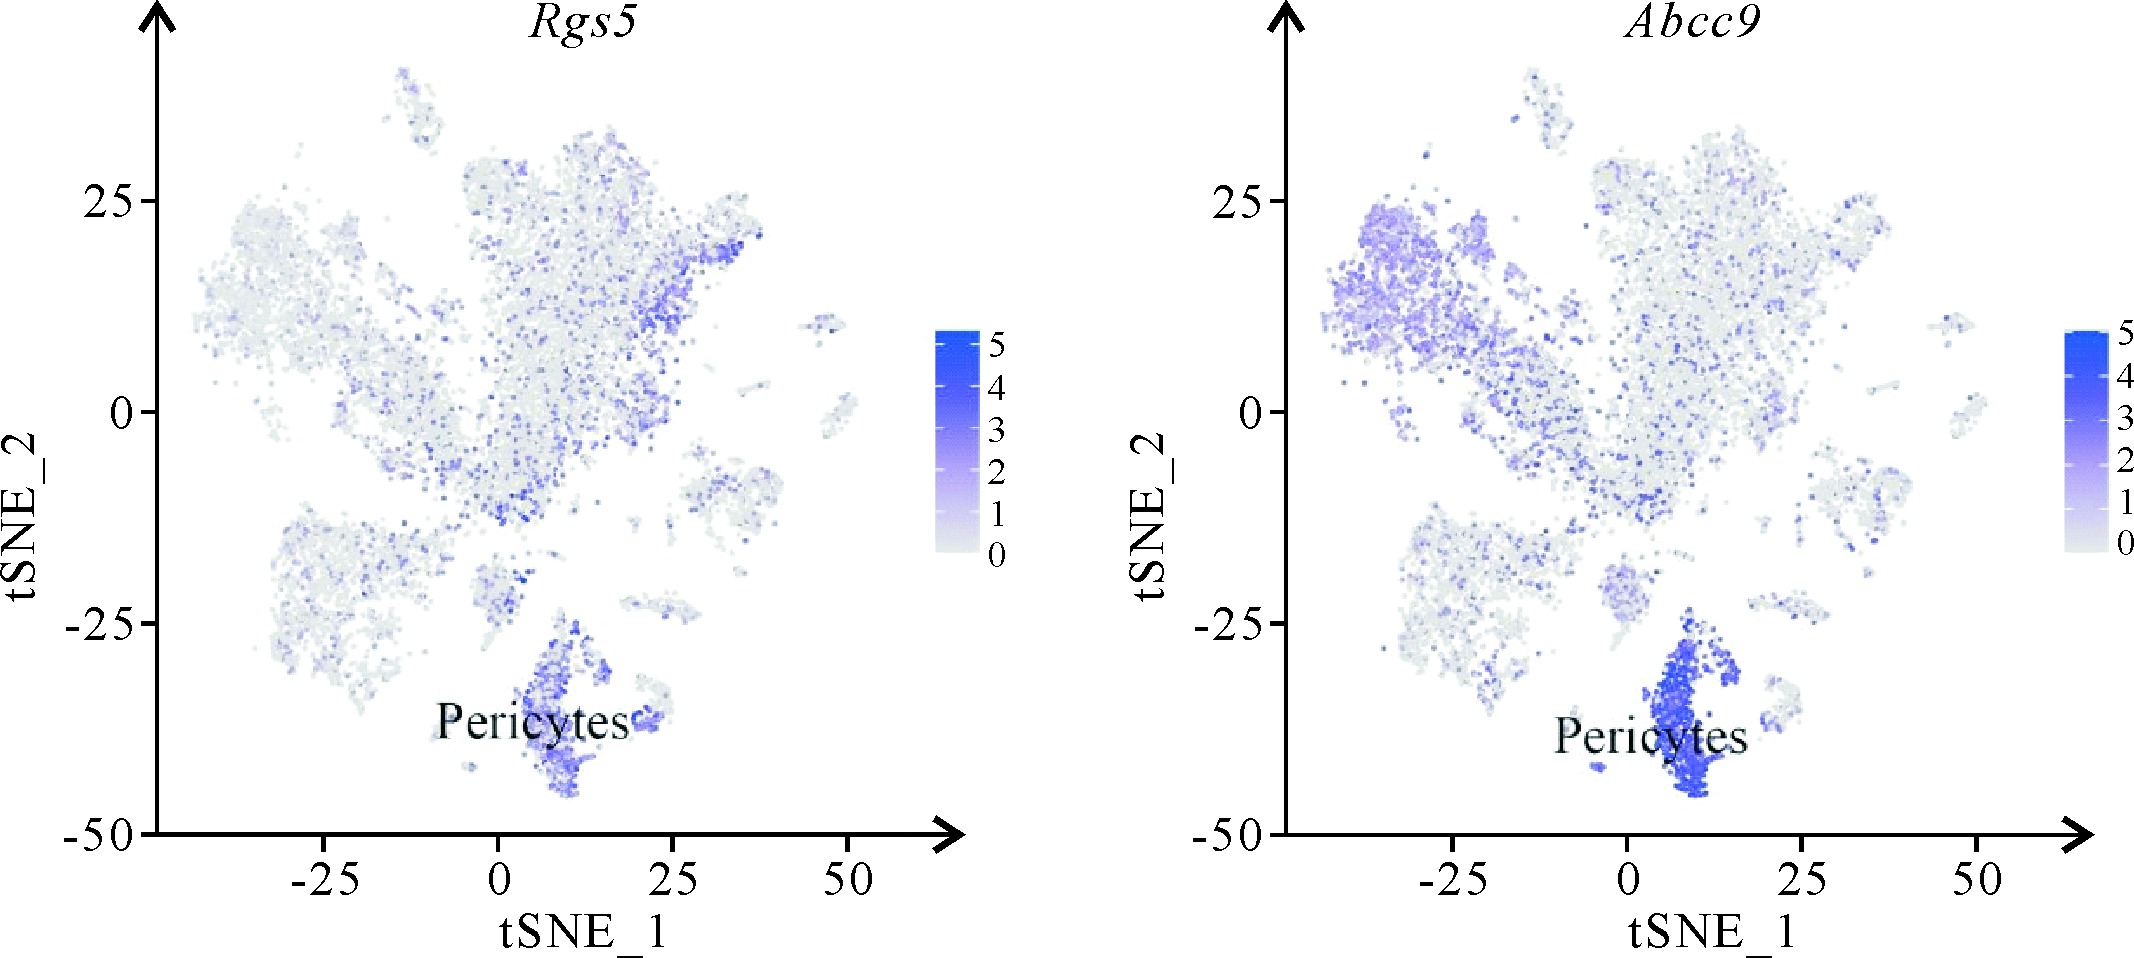
Figure 9
Marker genes of pericytes displayed by tSNE clustering
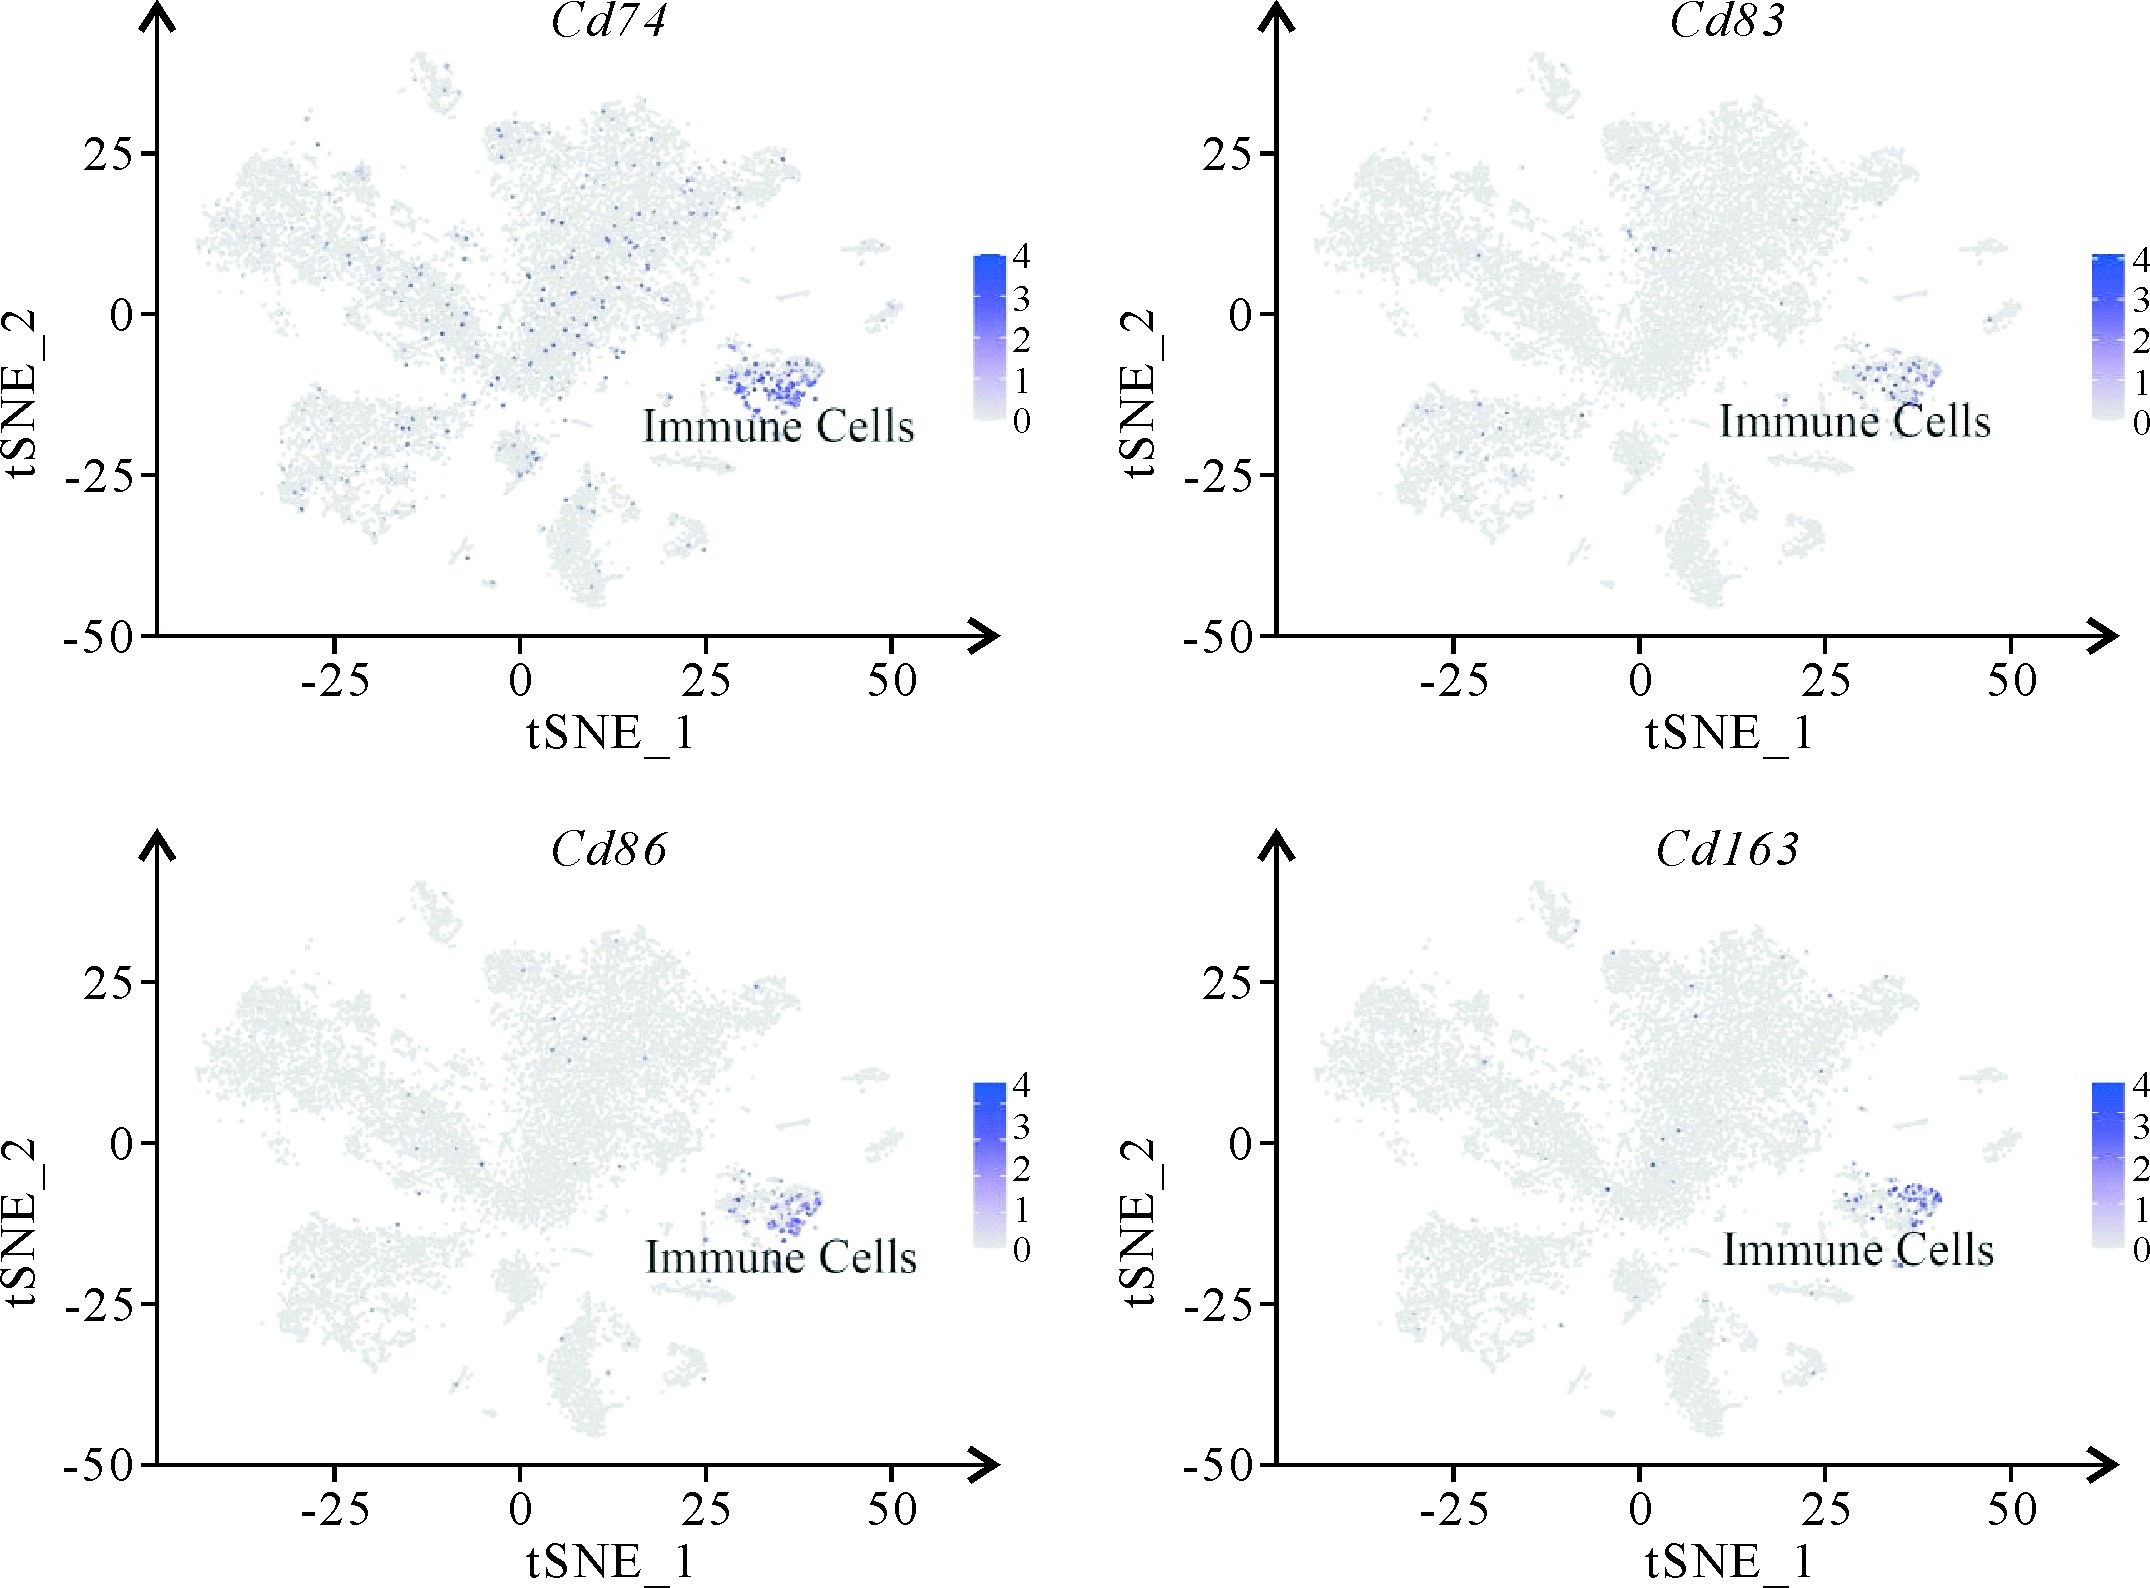
Figure 10
Marker genes of immune cells displayed by tSNE clustering
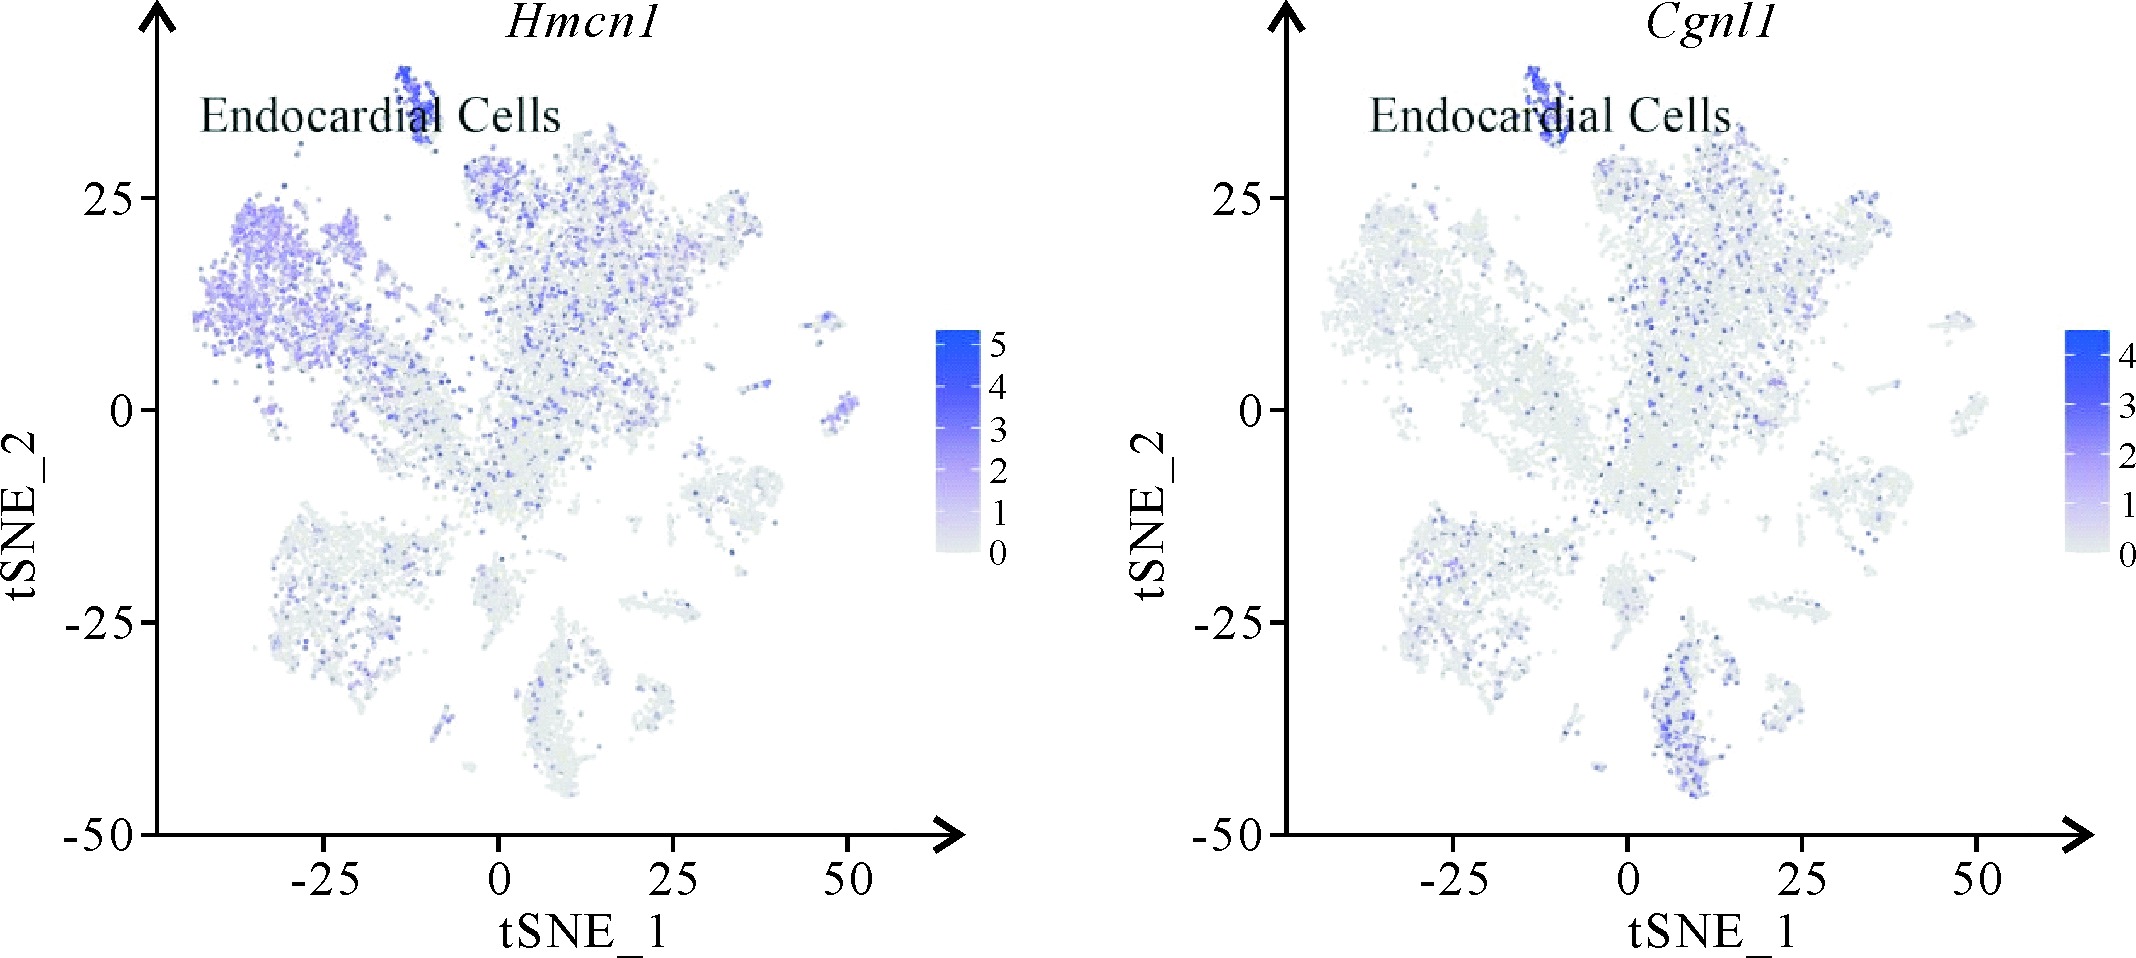
Figure 11
Marker genes of endocardial cells displayed by tSNE clustering
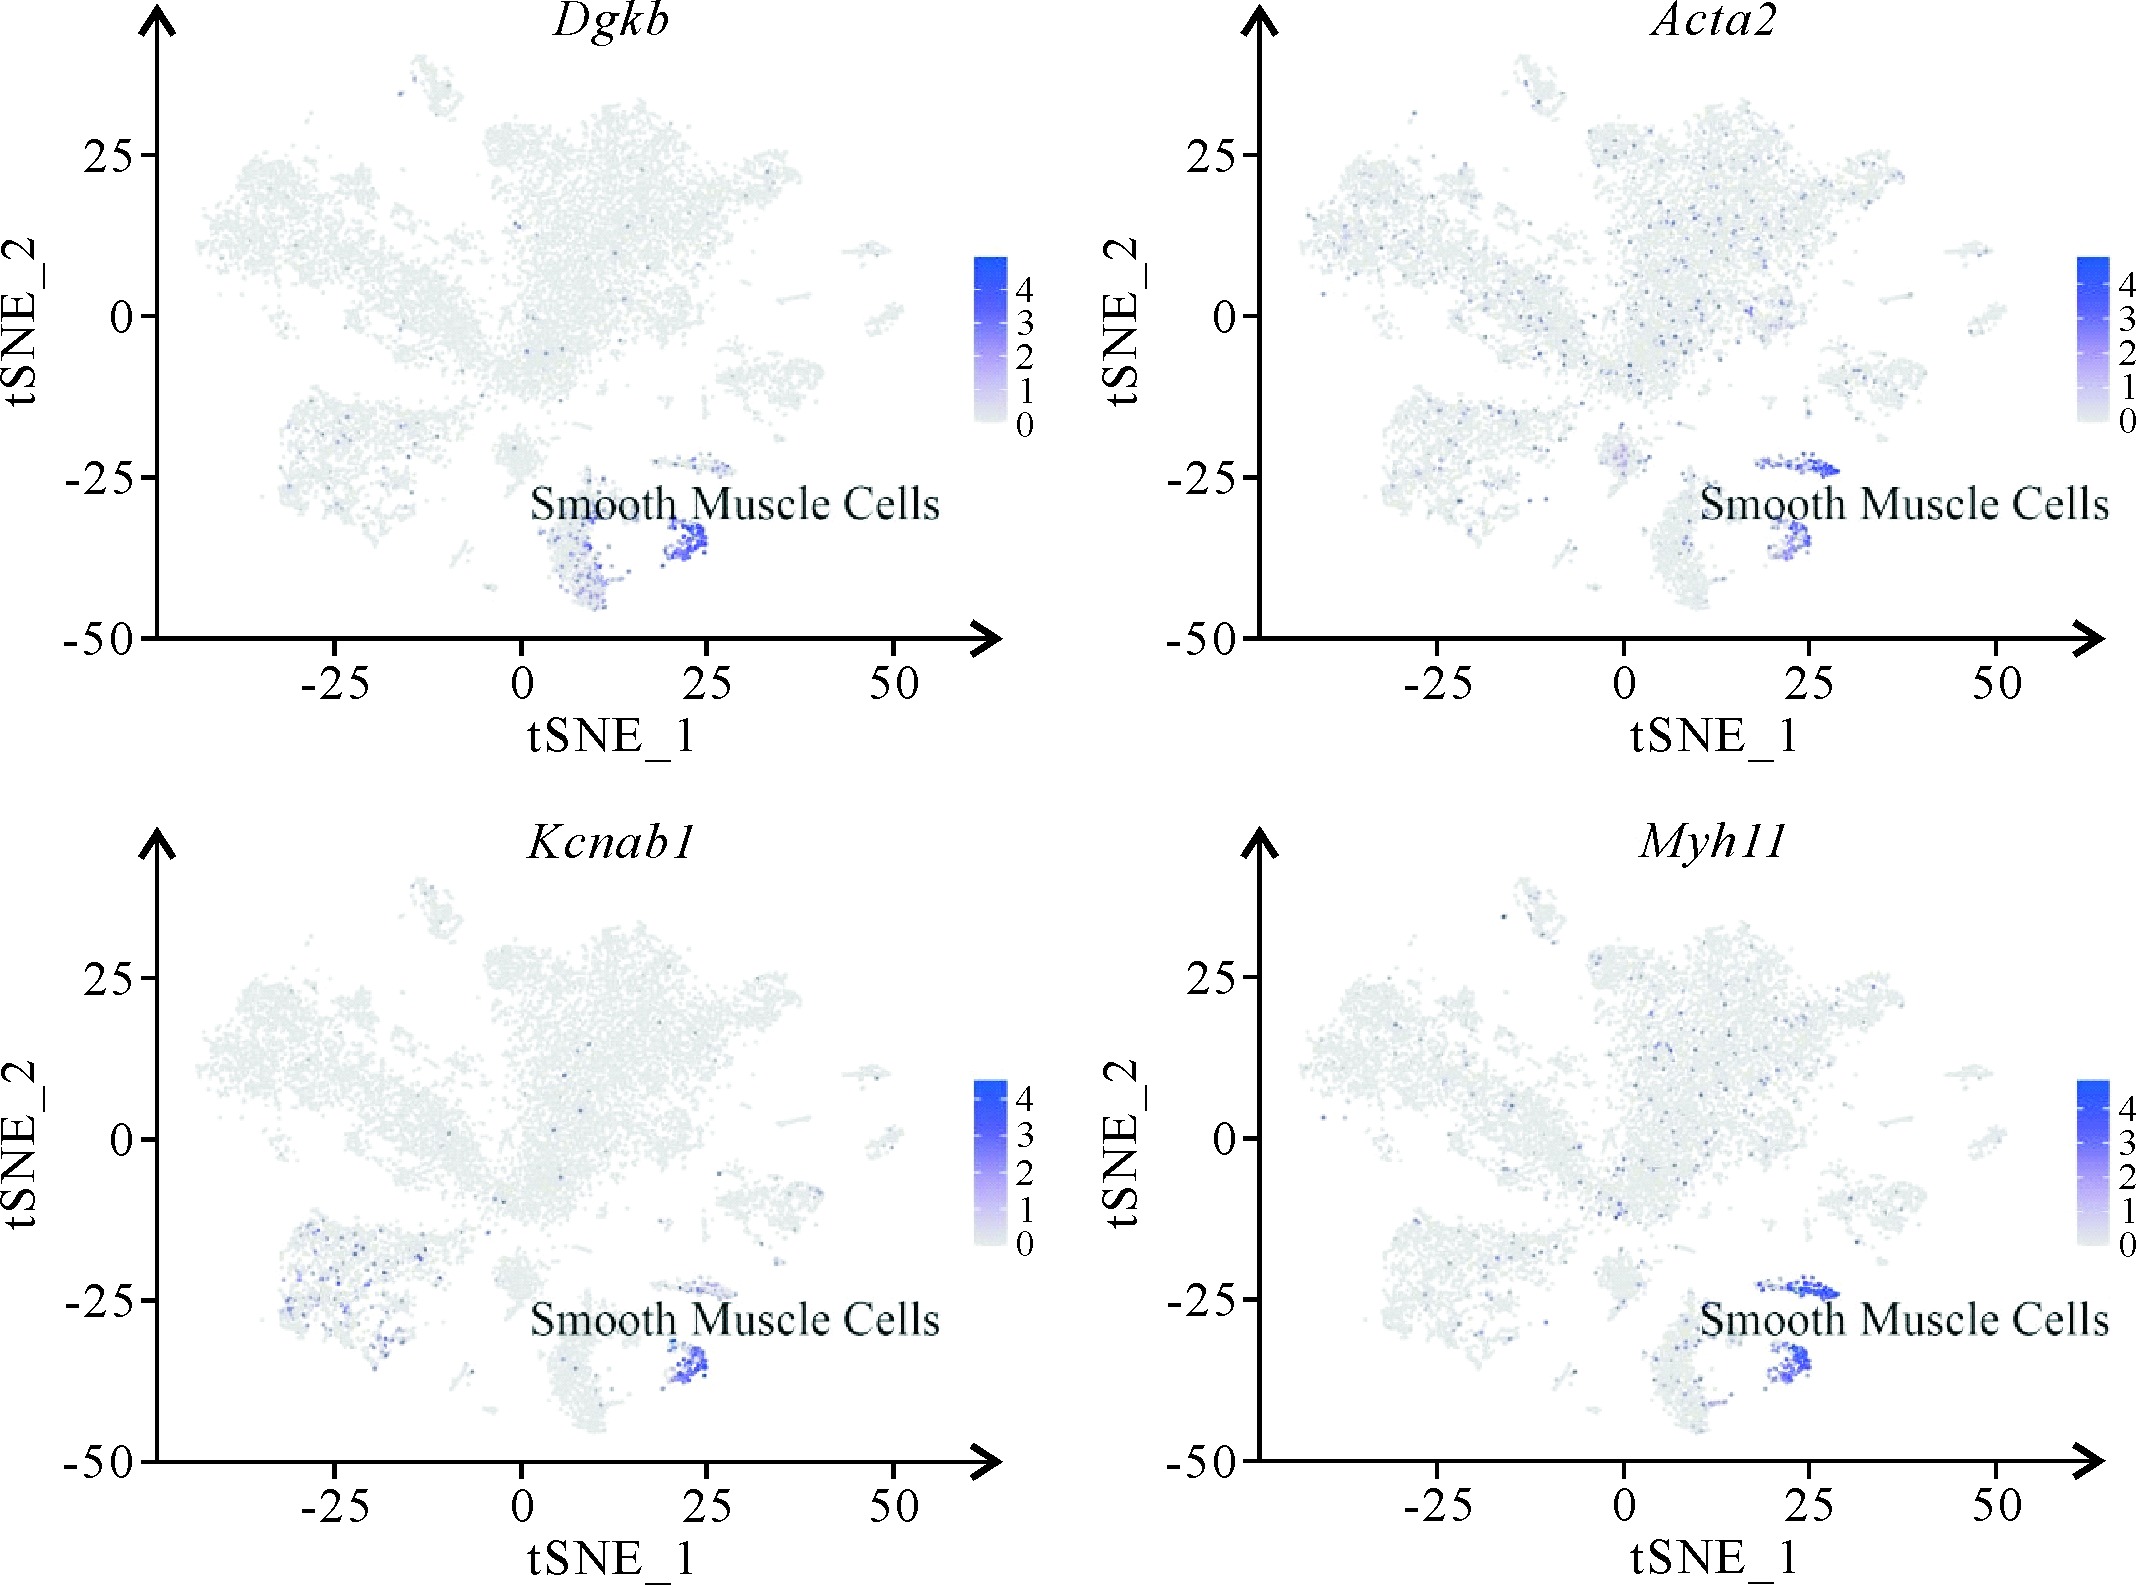
Figure 12
Marker genes of smooth muscle cells displayed by tSNE clustering
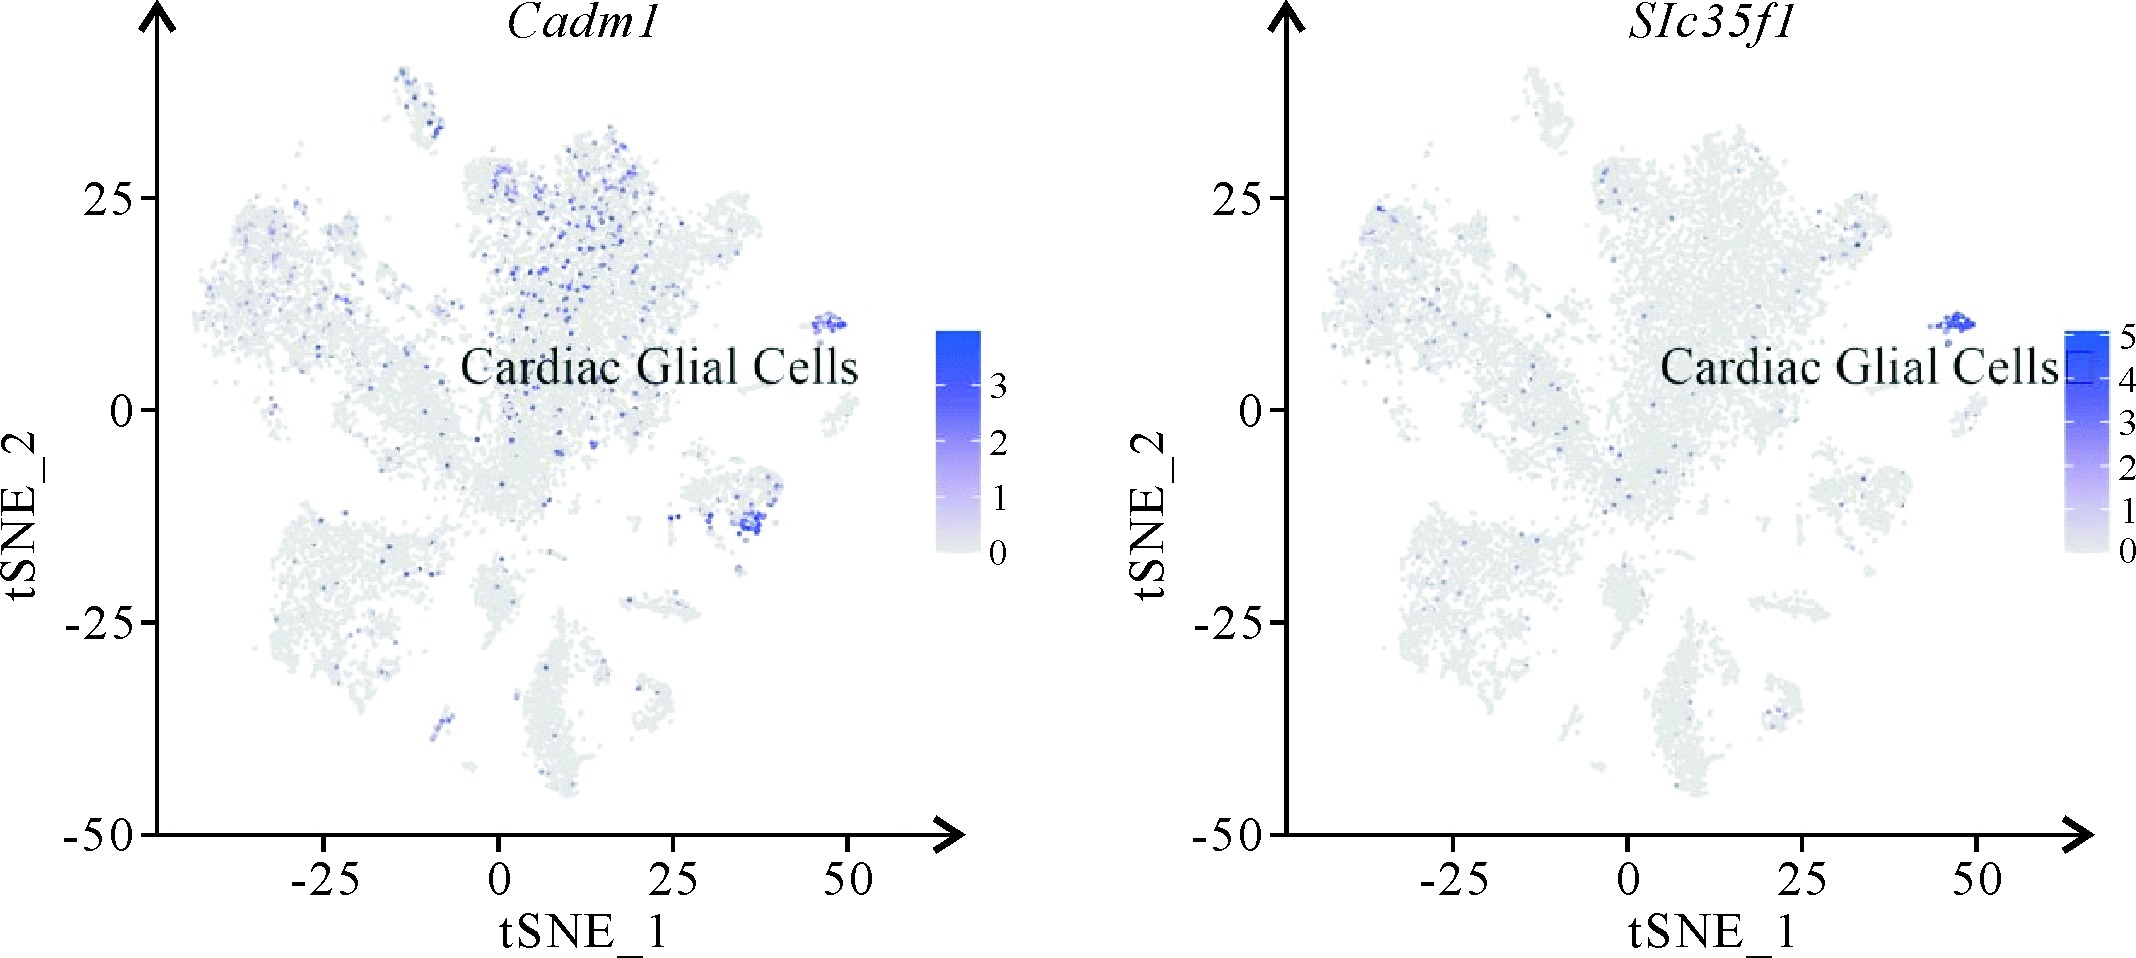
Figure 13
Marker genes of cardiac glial cells displayed by tSNE clustering
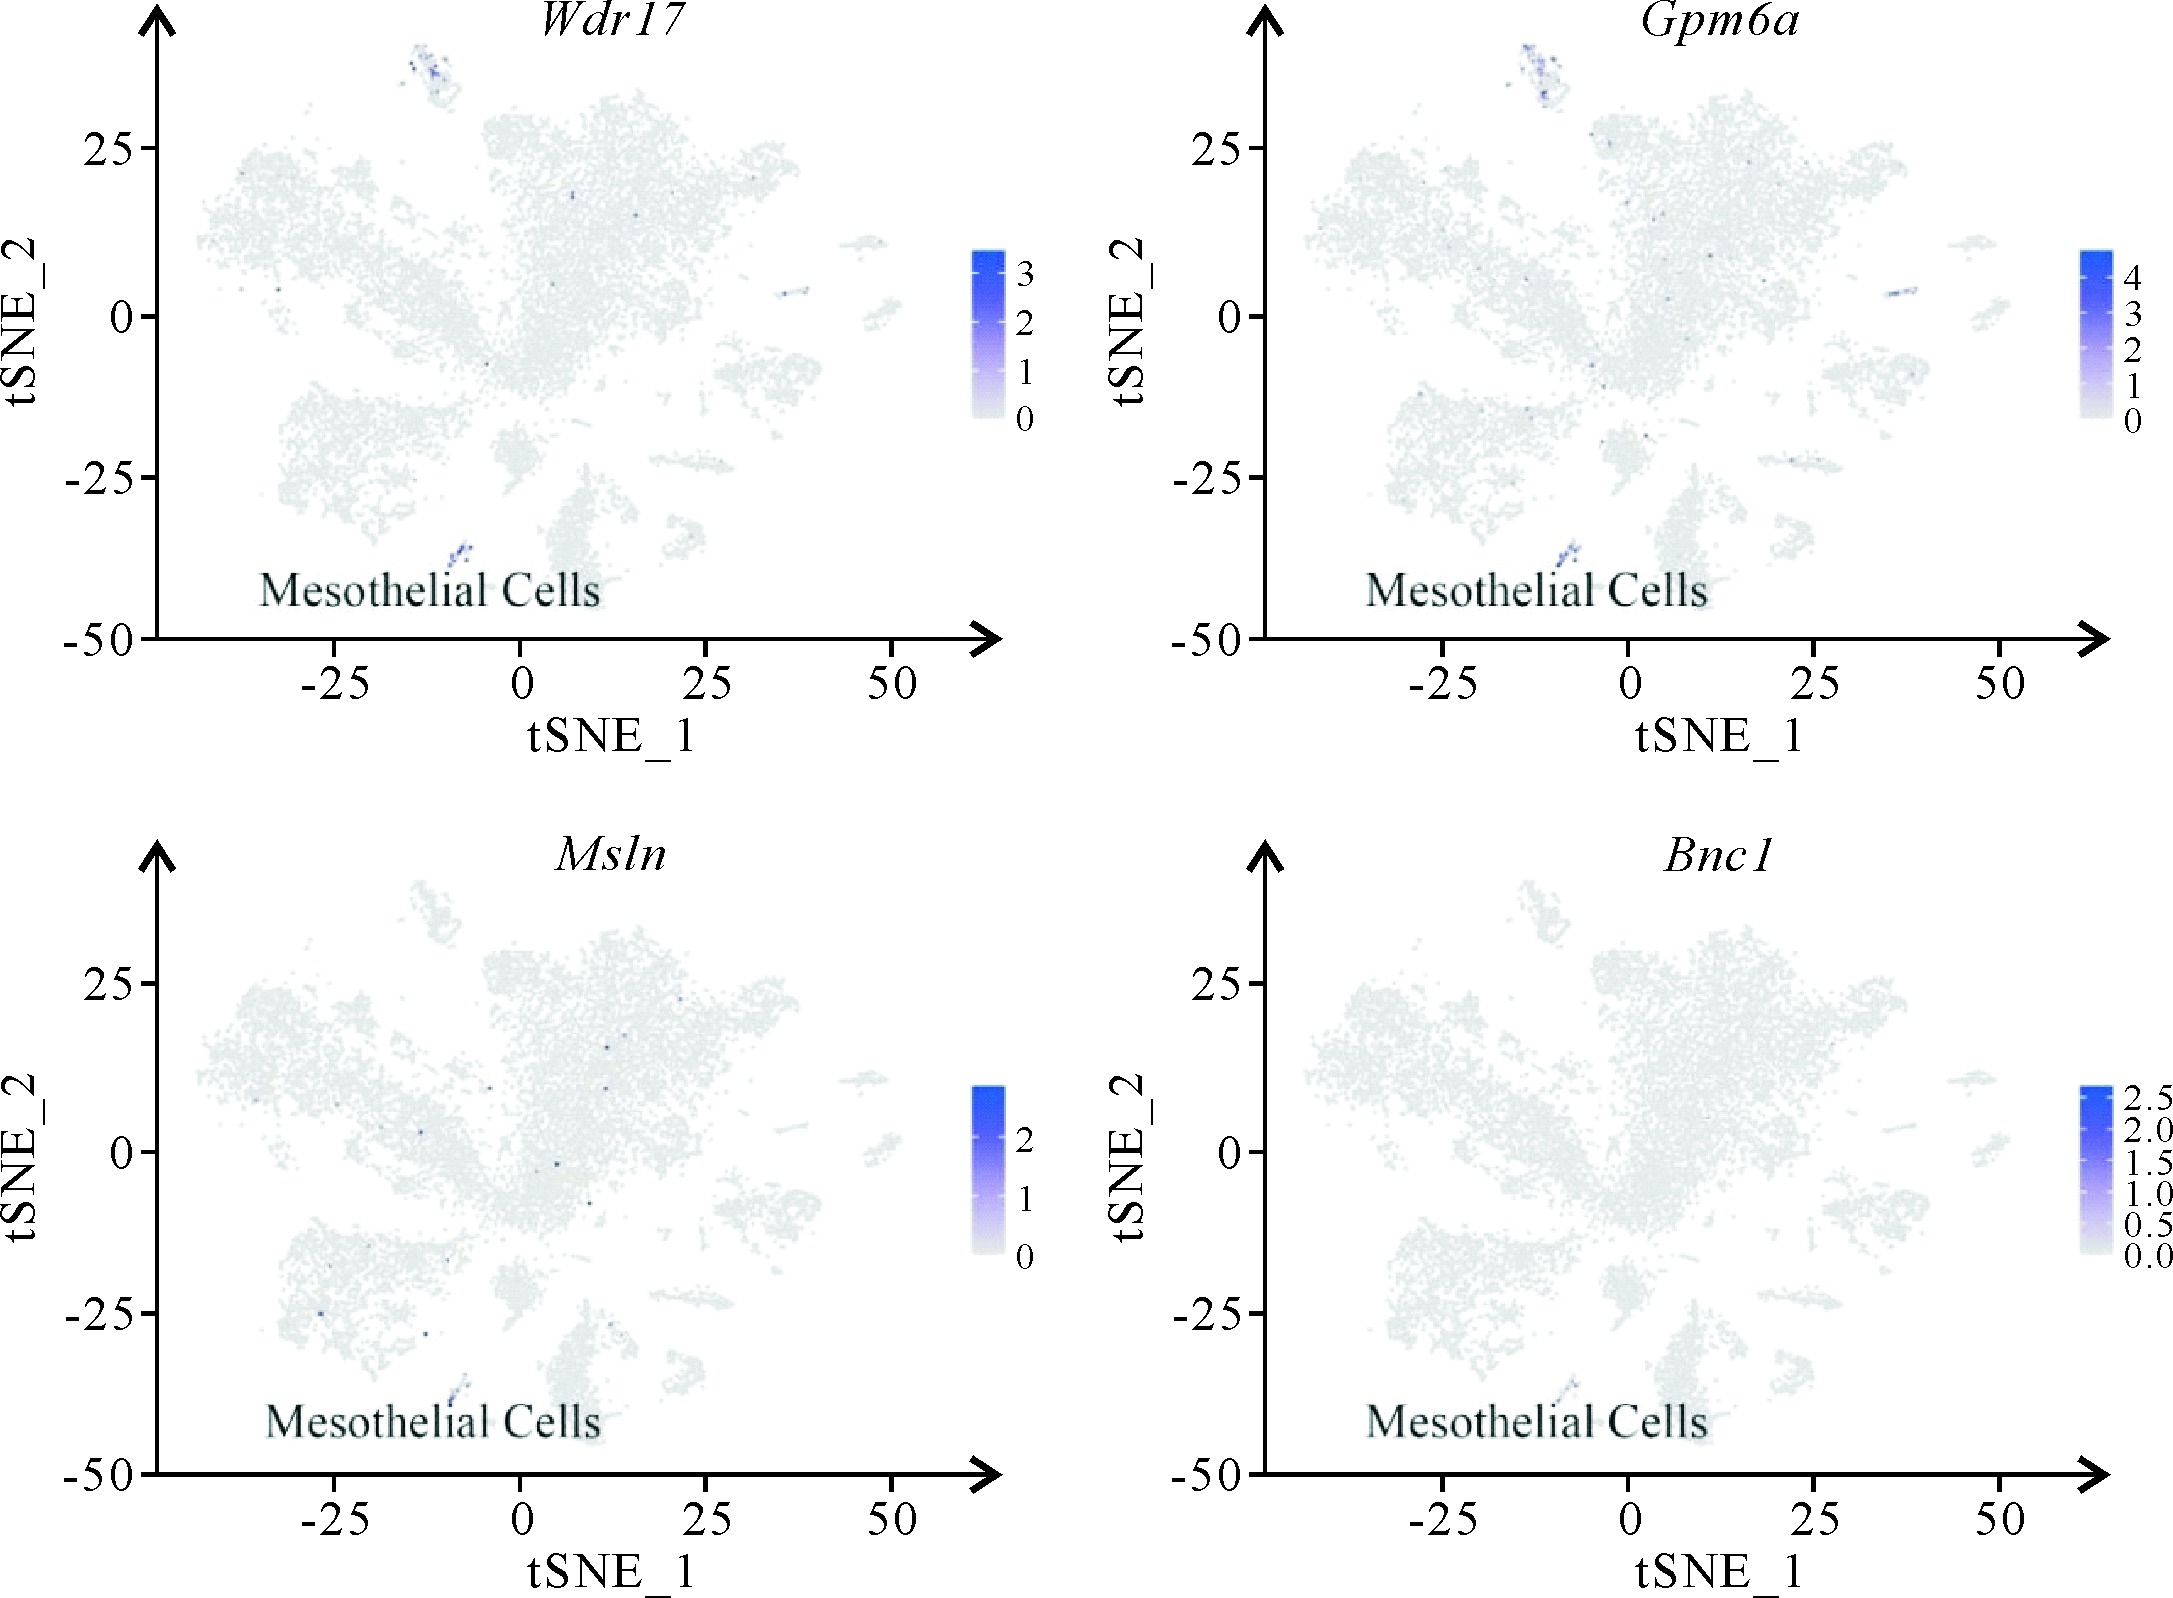
Figure 14
Marker genes of mesothelial cells displayed by tSNE clustering
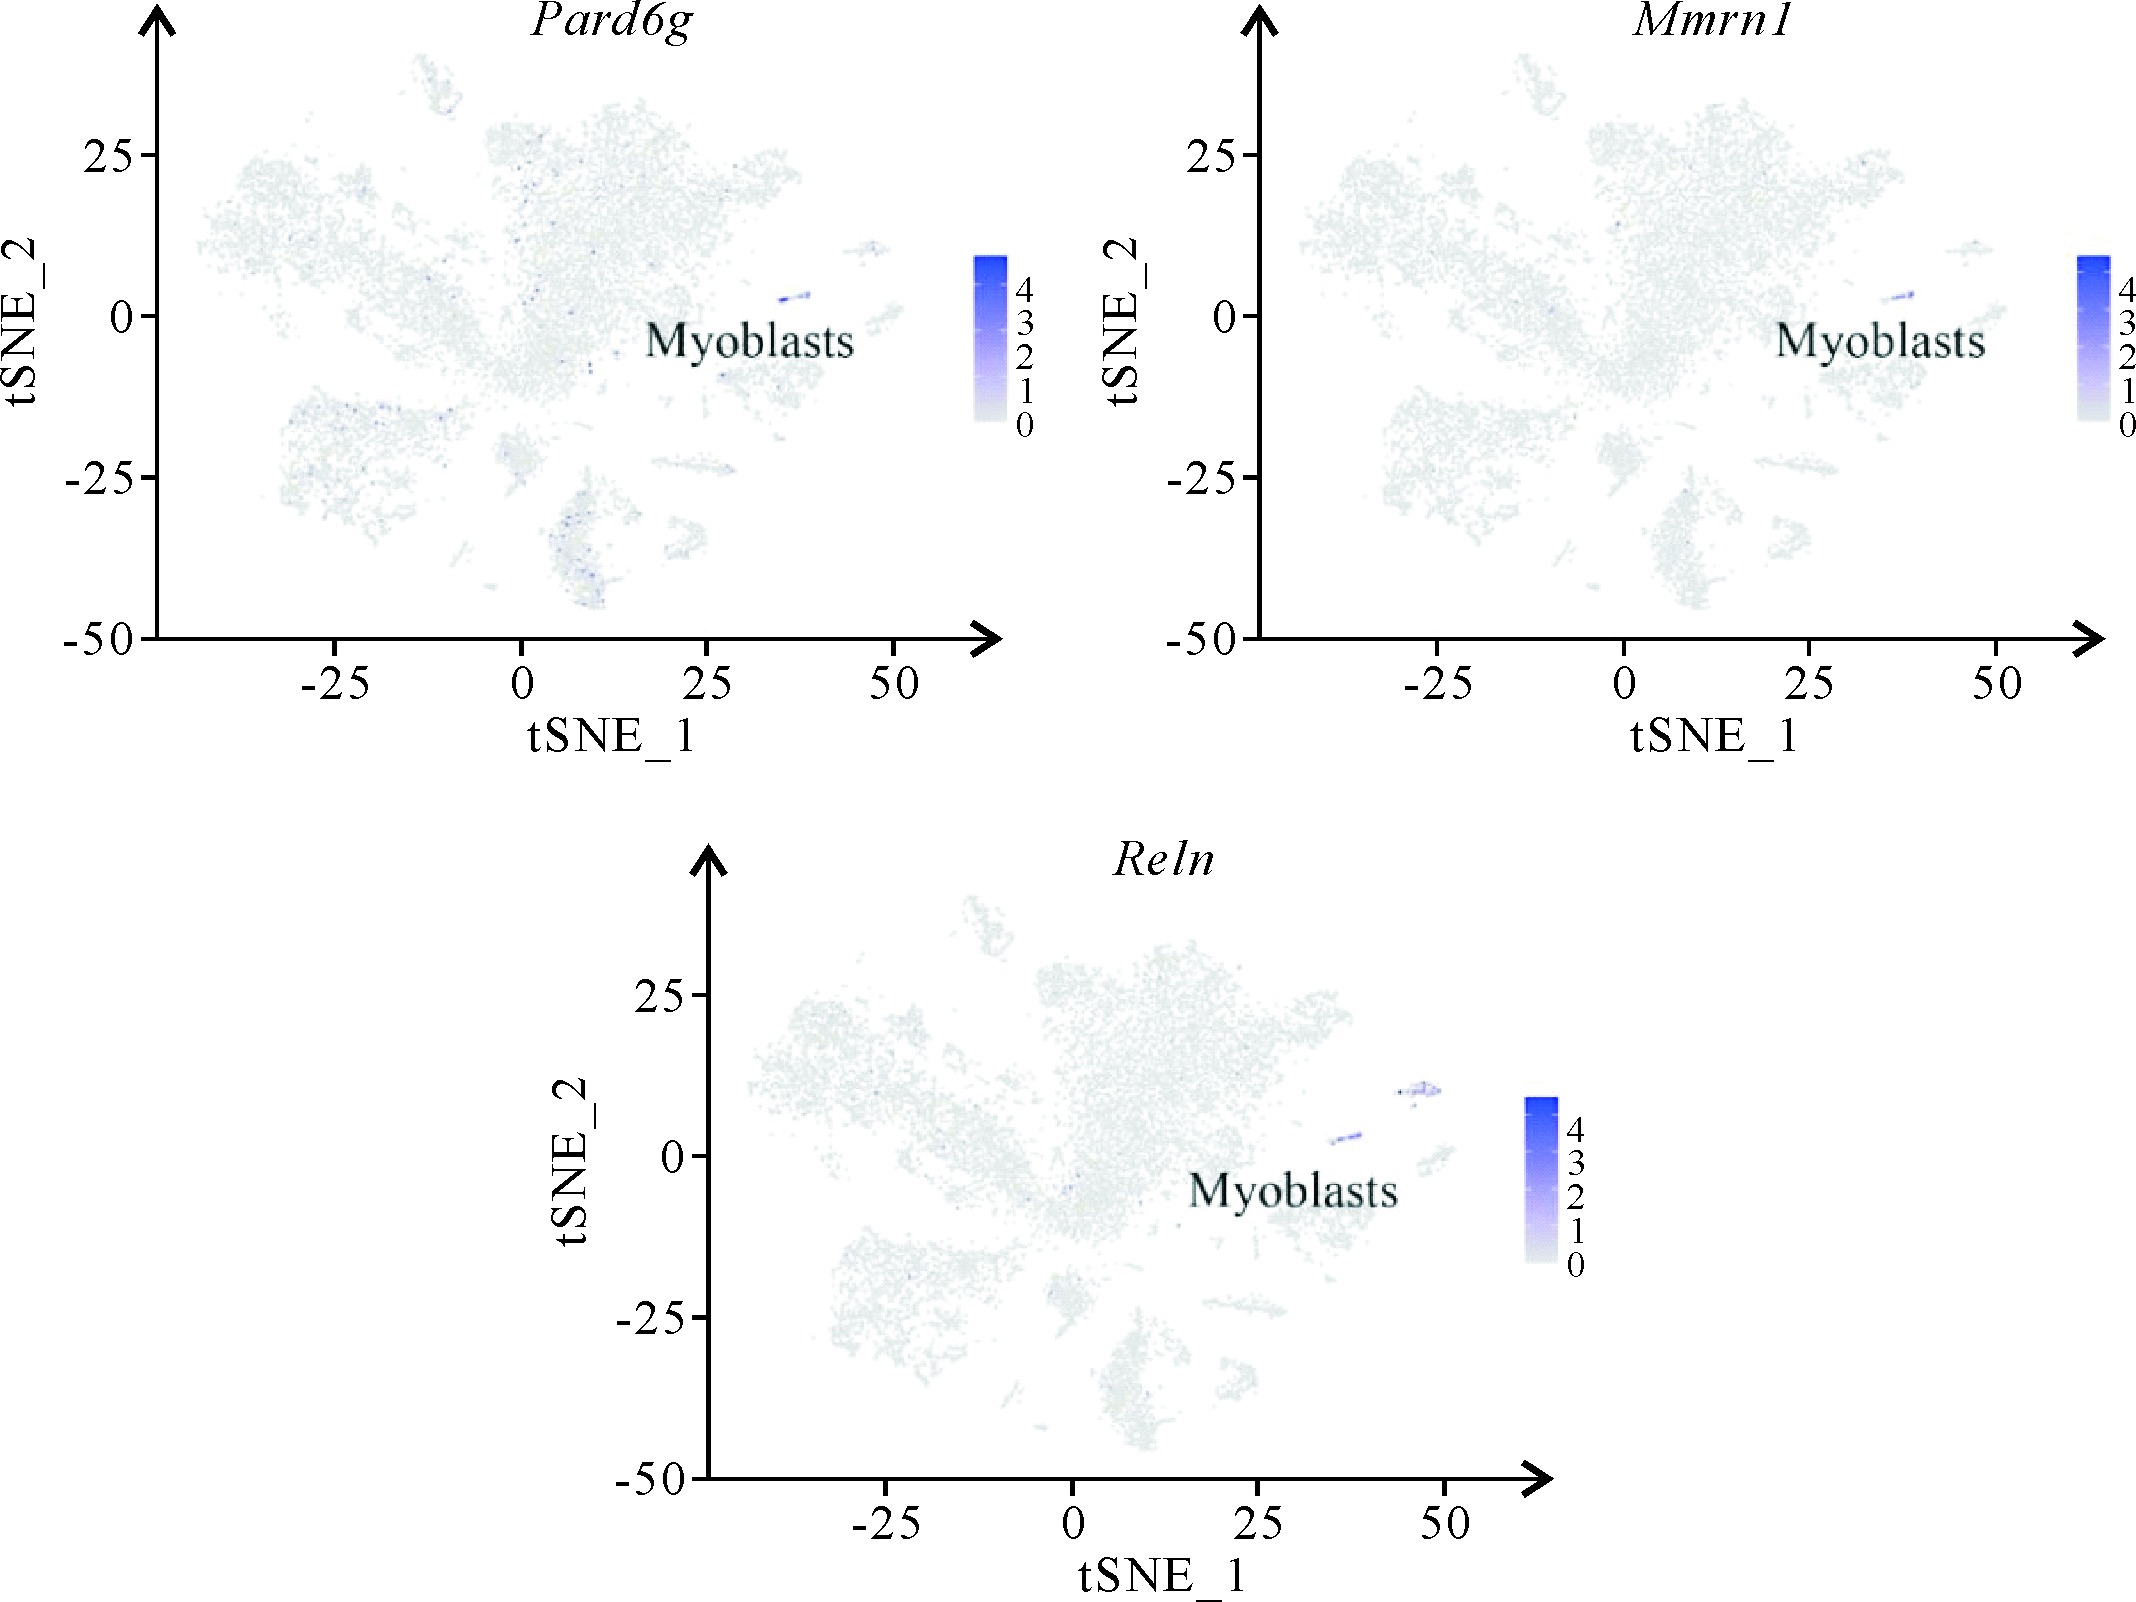
Figure 15
Marker genes of myoblasts displayed by tSNE clustering
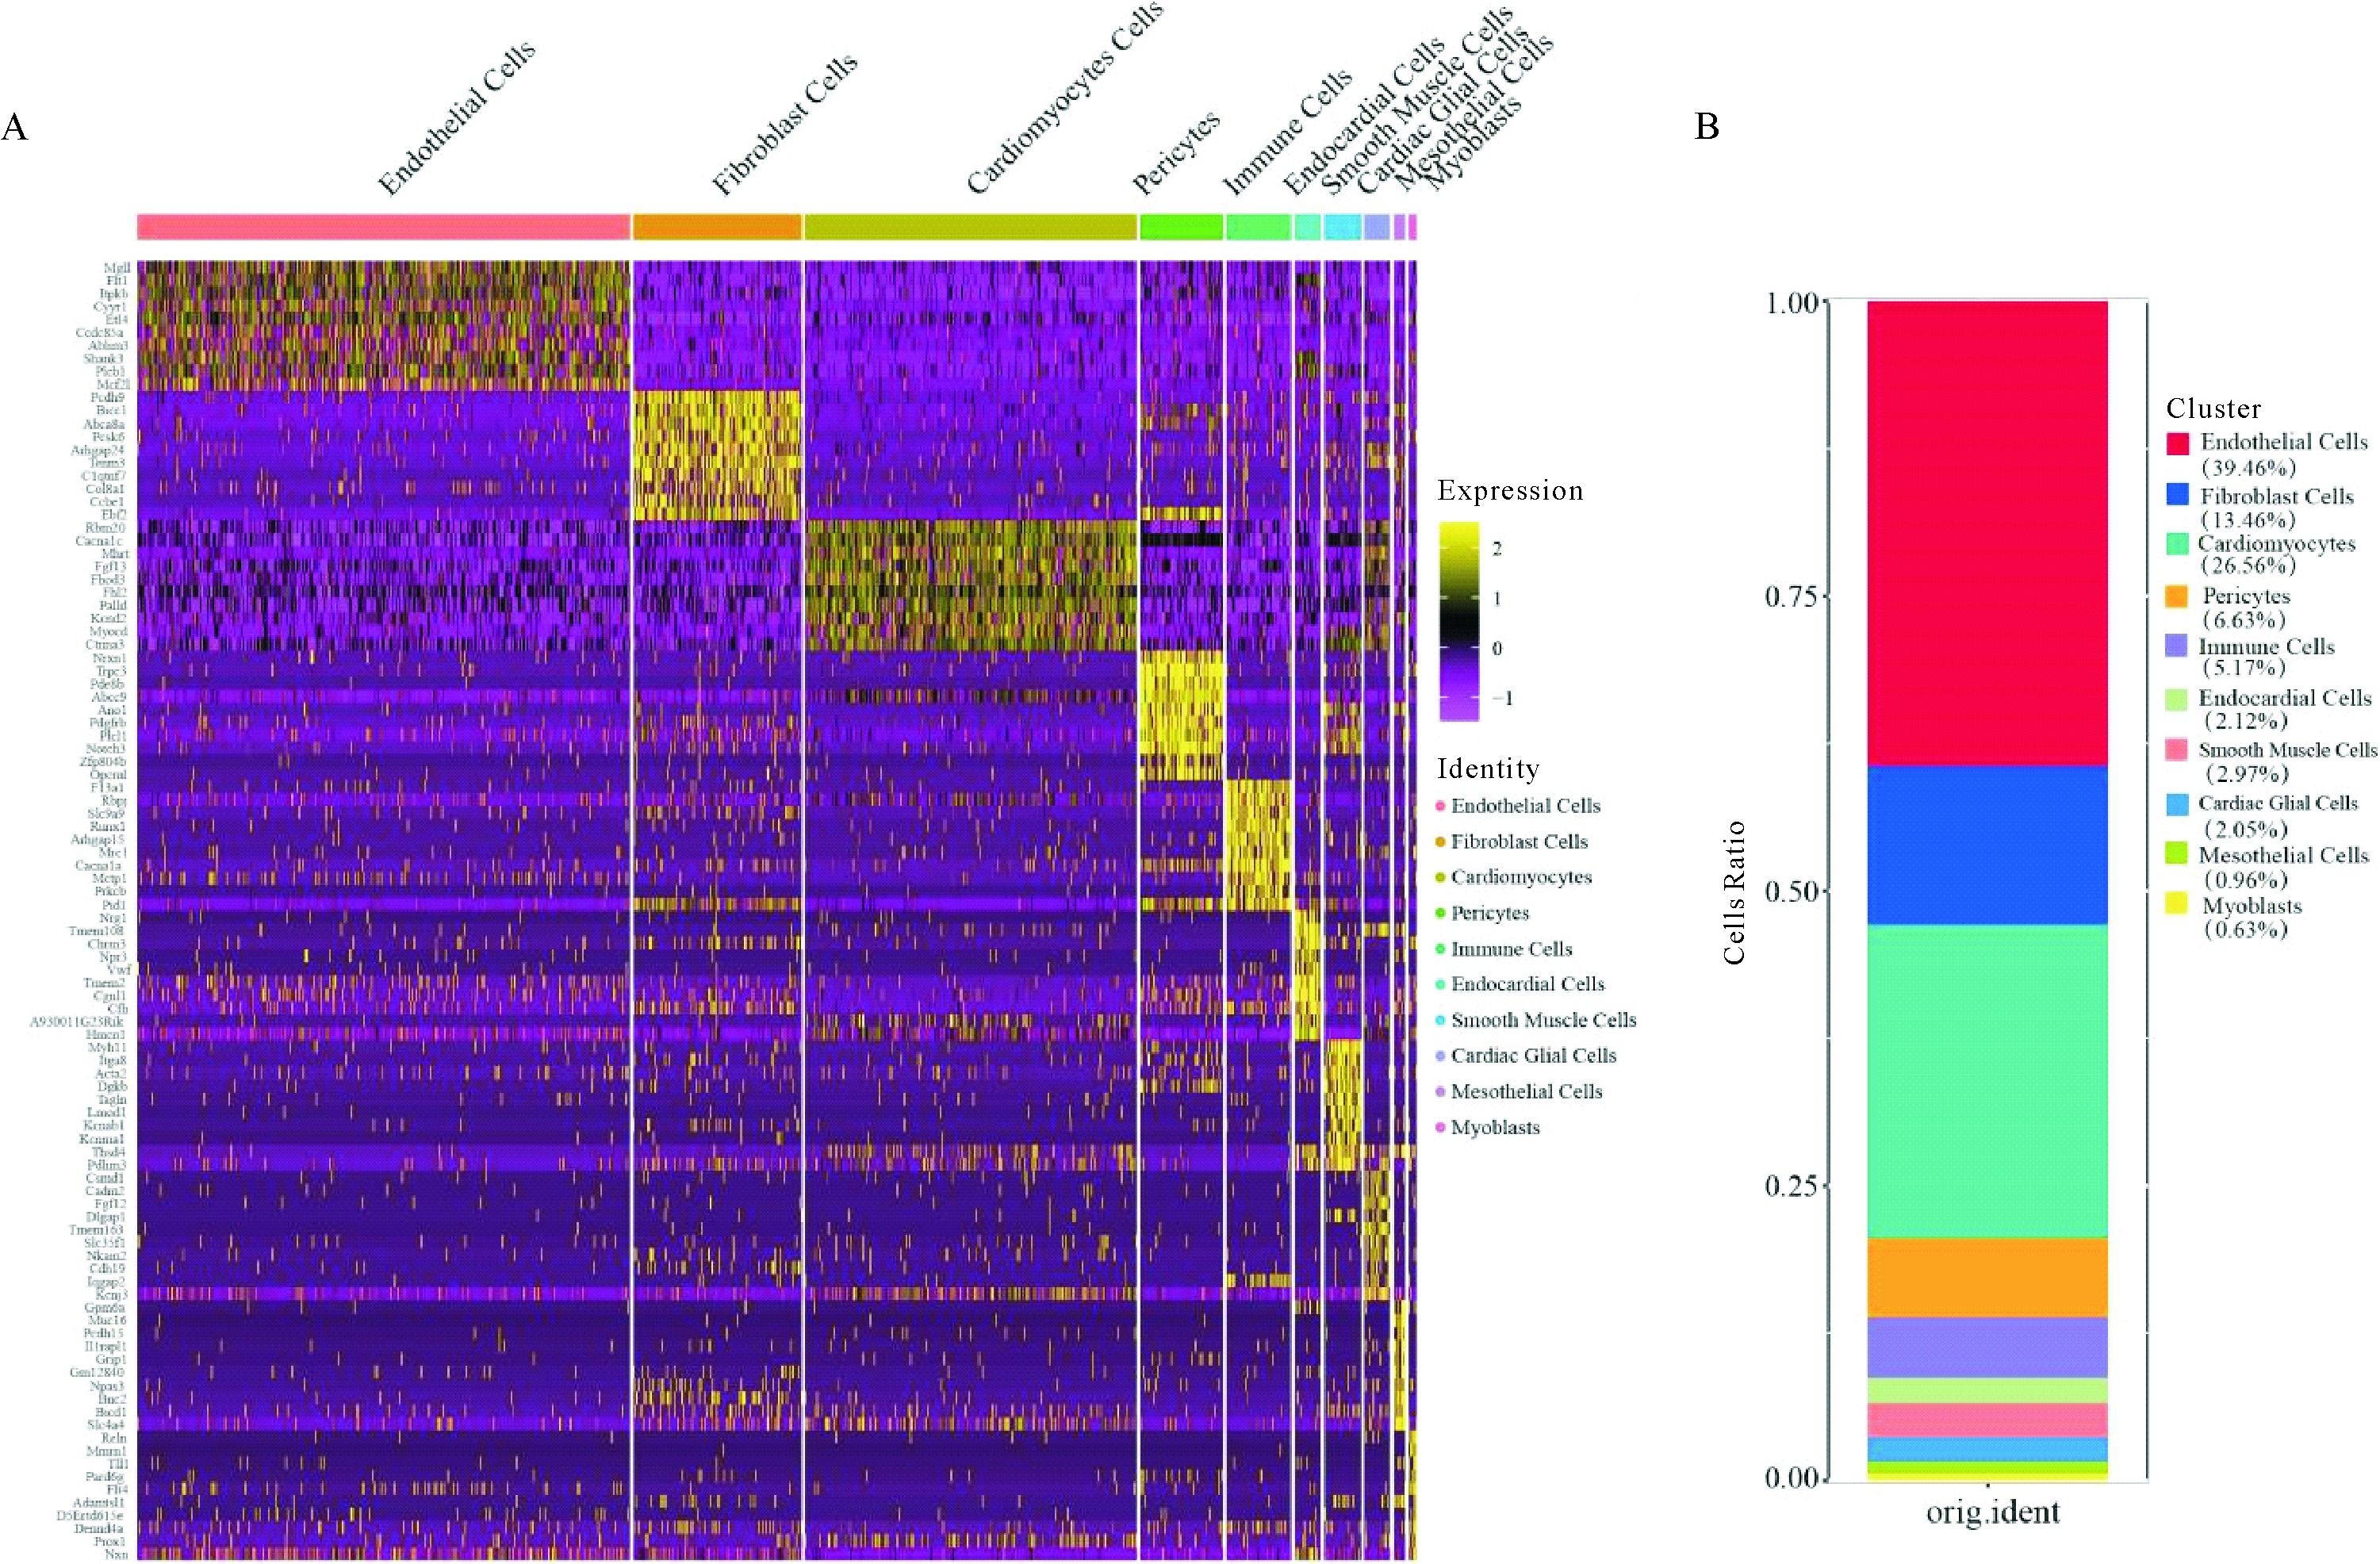
Figure 16
The heat map of top ten differential expression genes in different cell populations and the proportion of different cell types in mouse heart
A: The heat map of top ten differential expression genes in different cell populations of mouse heart; B: The proportion of different cell types of mouse heart
Table 1
tSNE cell attribute


 粤ICP备12087612号