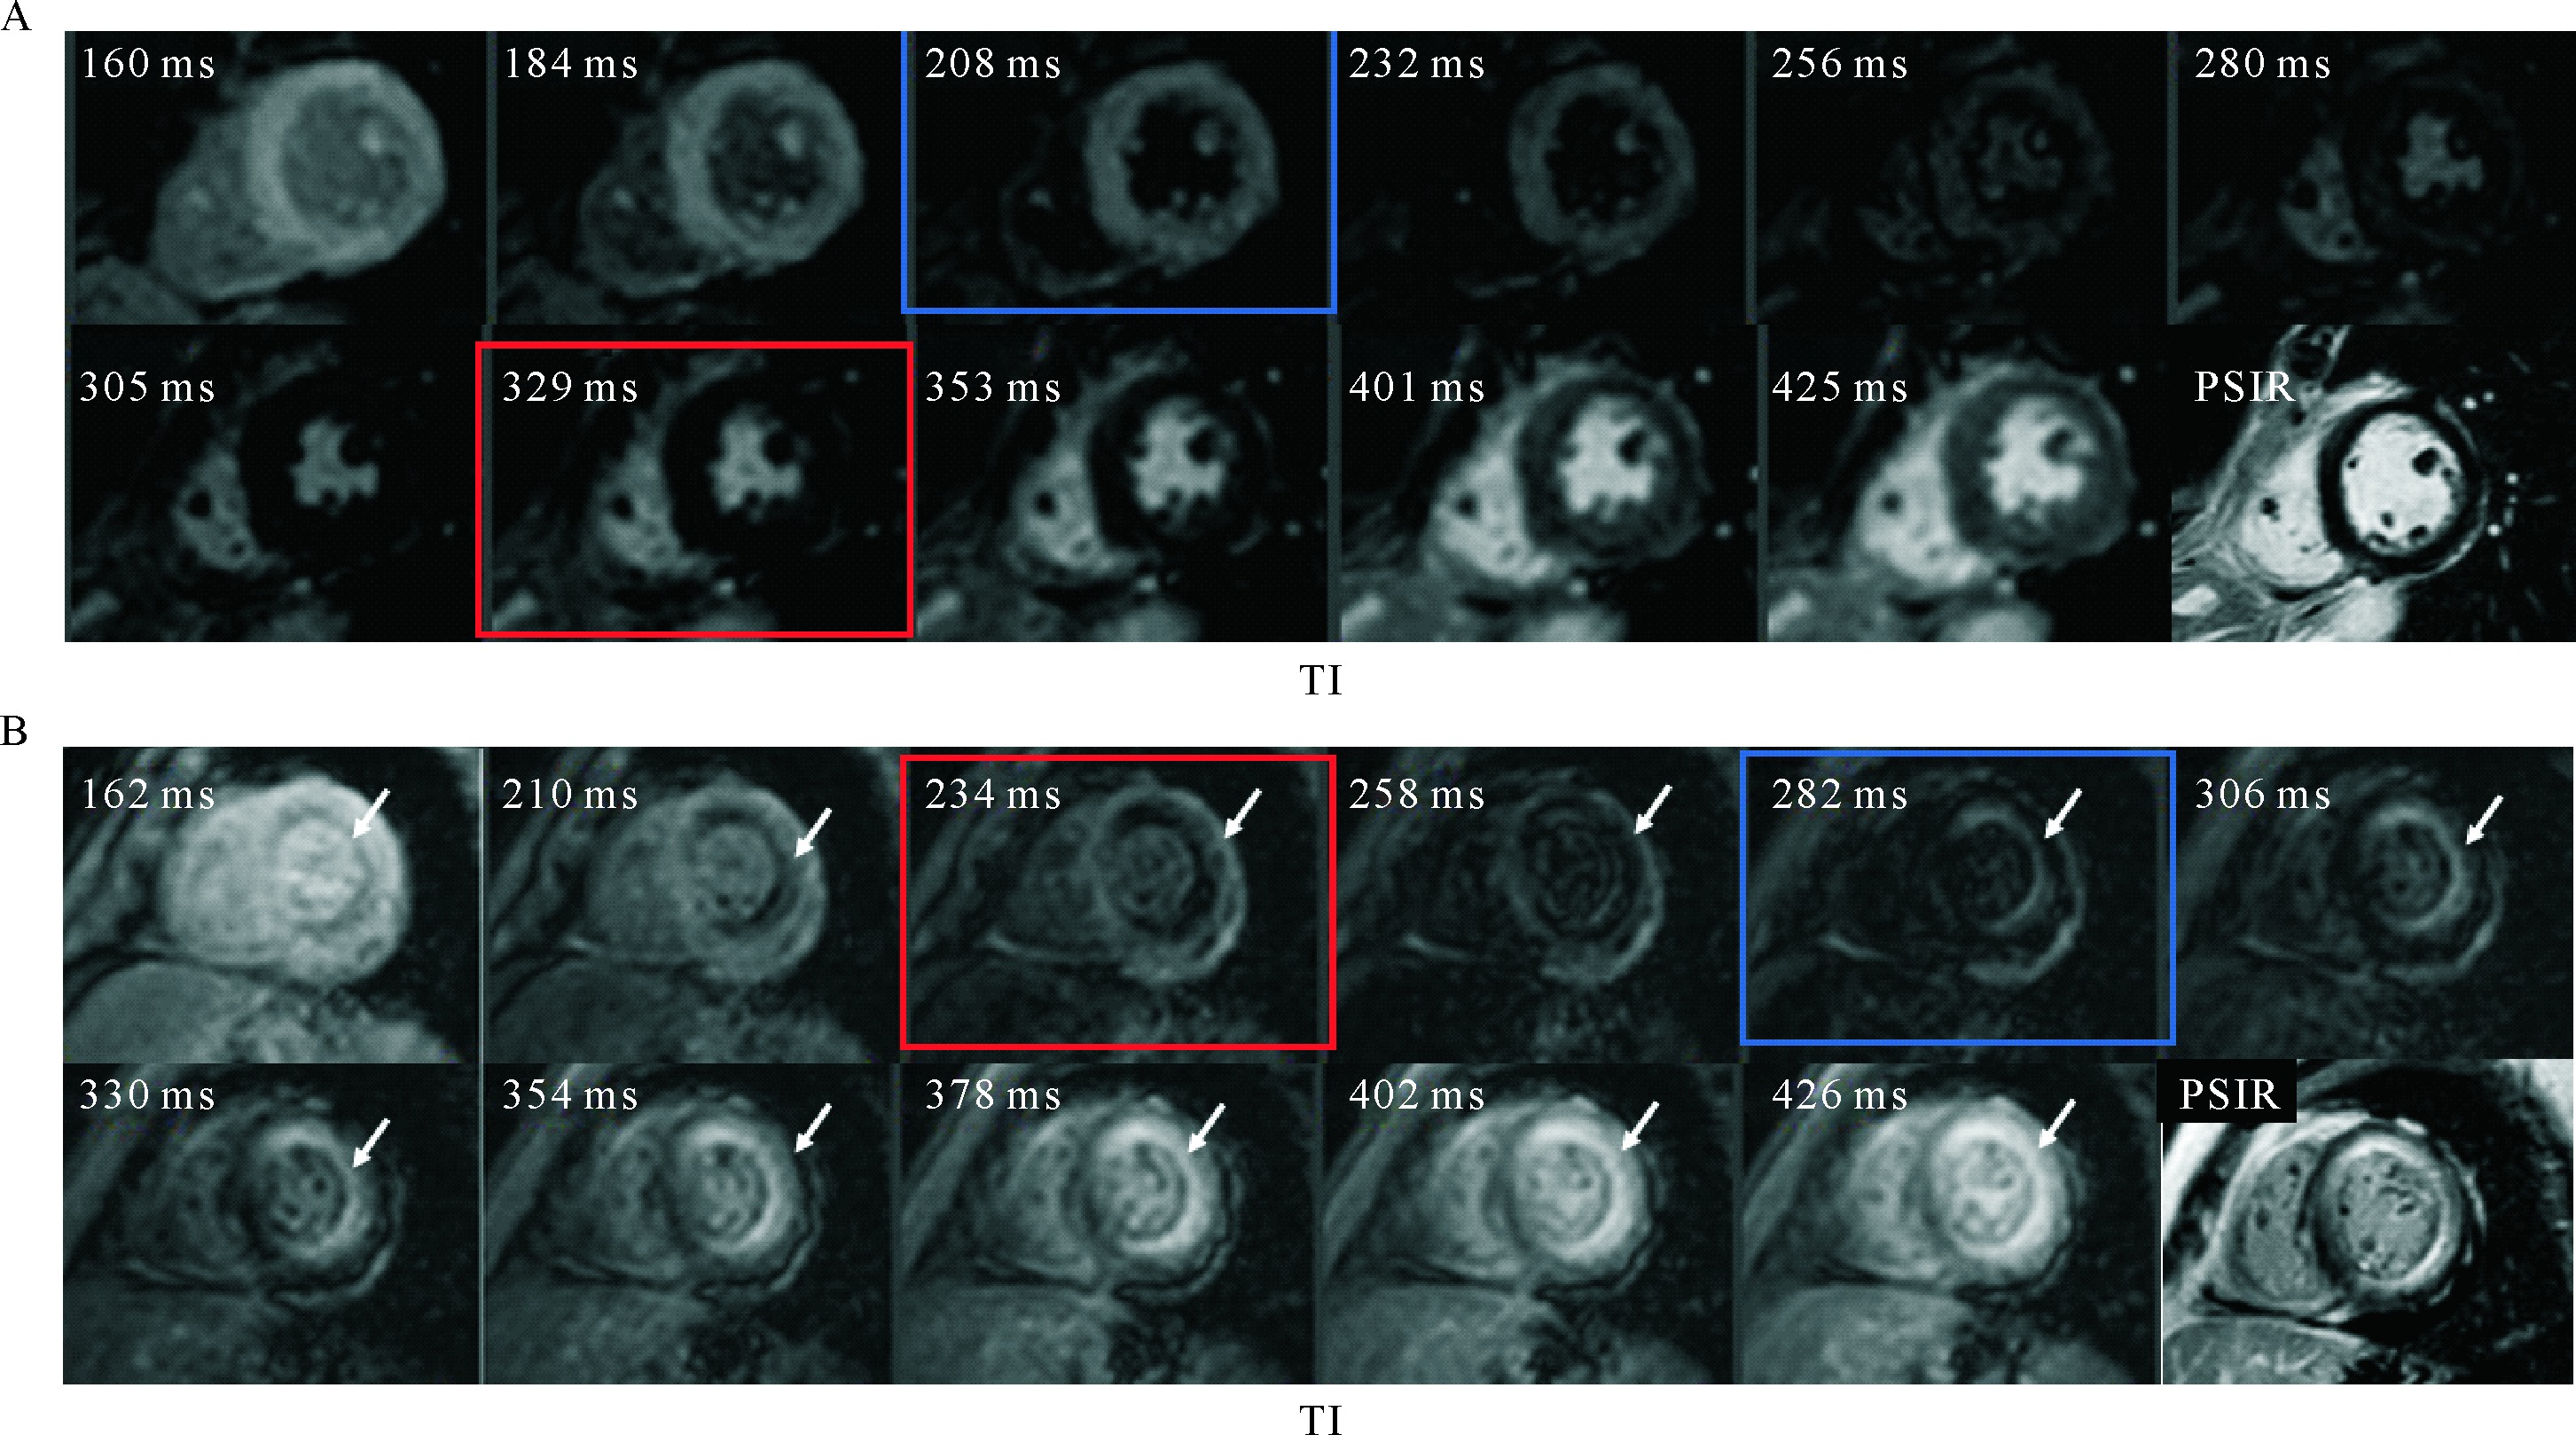
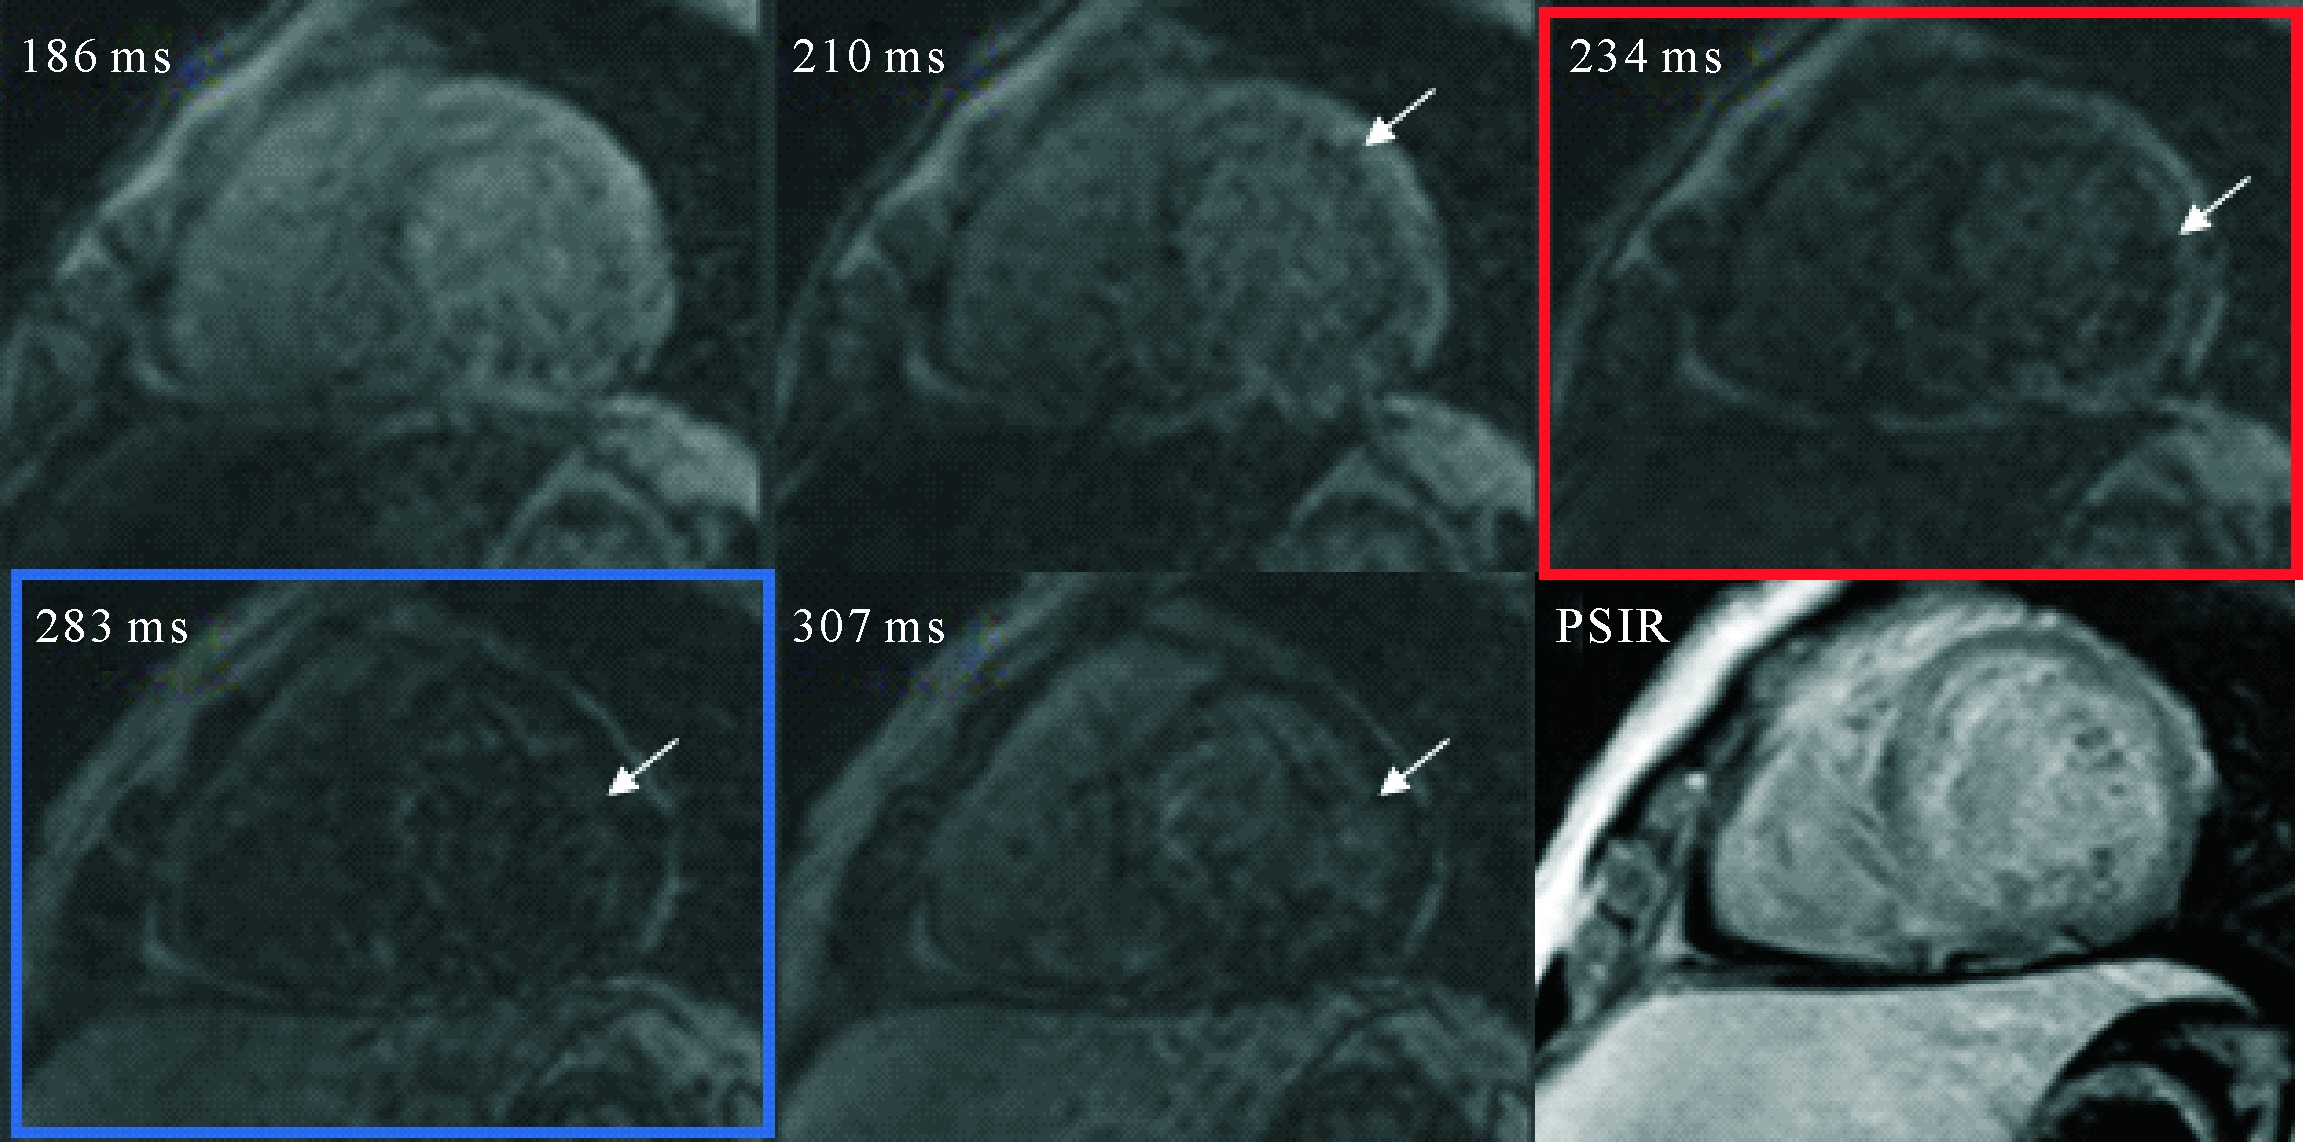
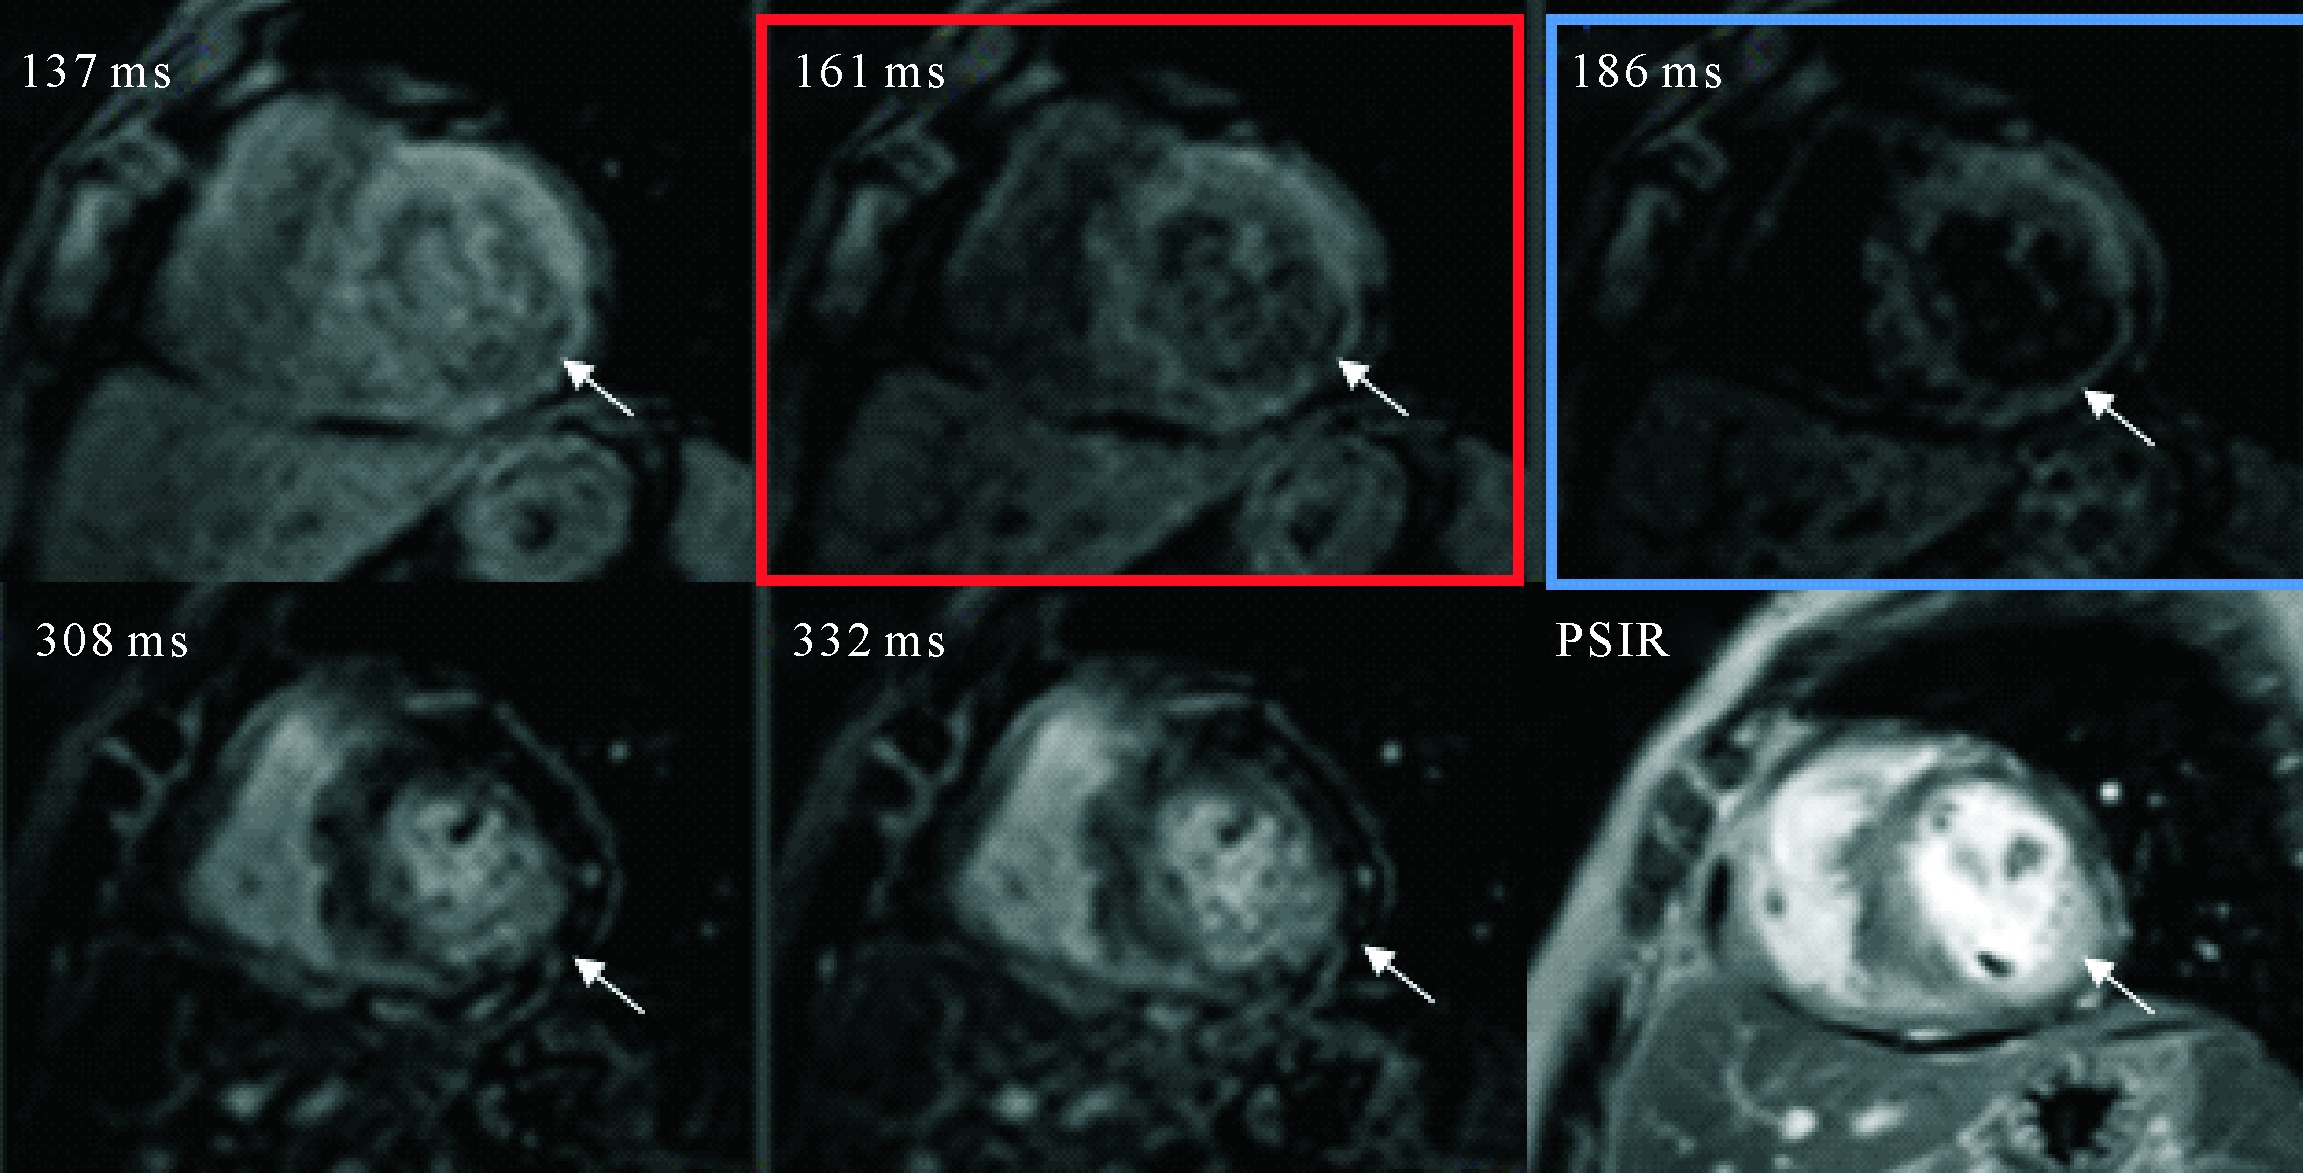
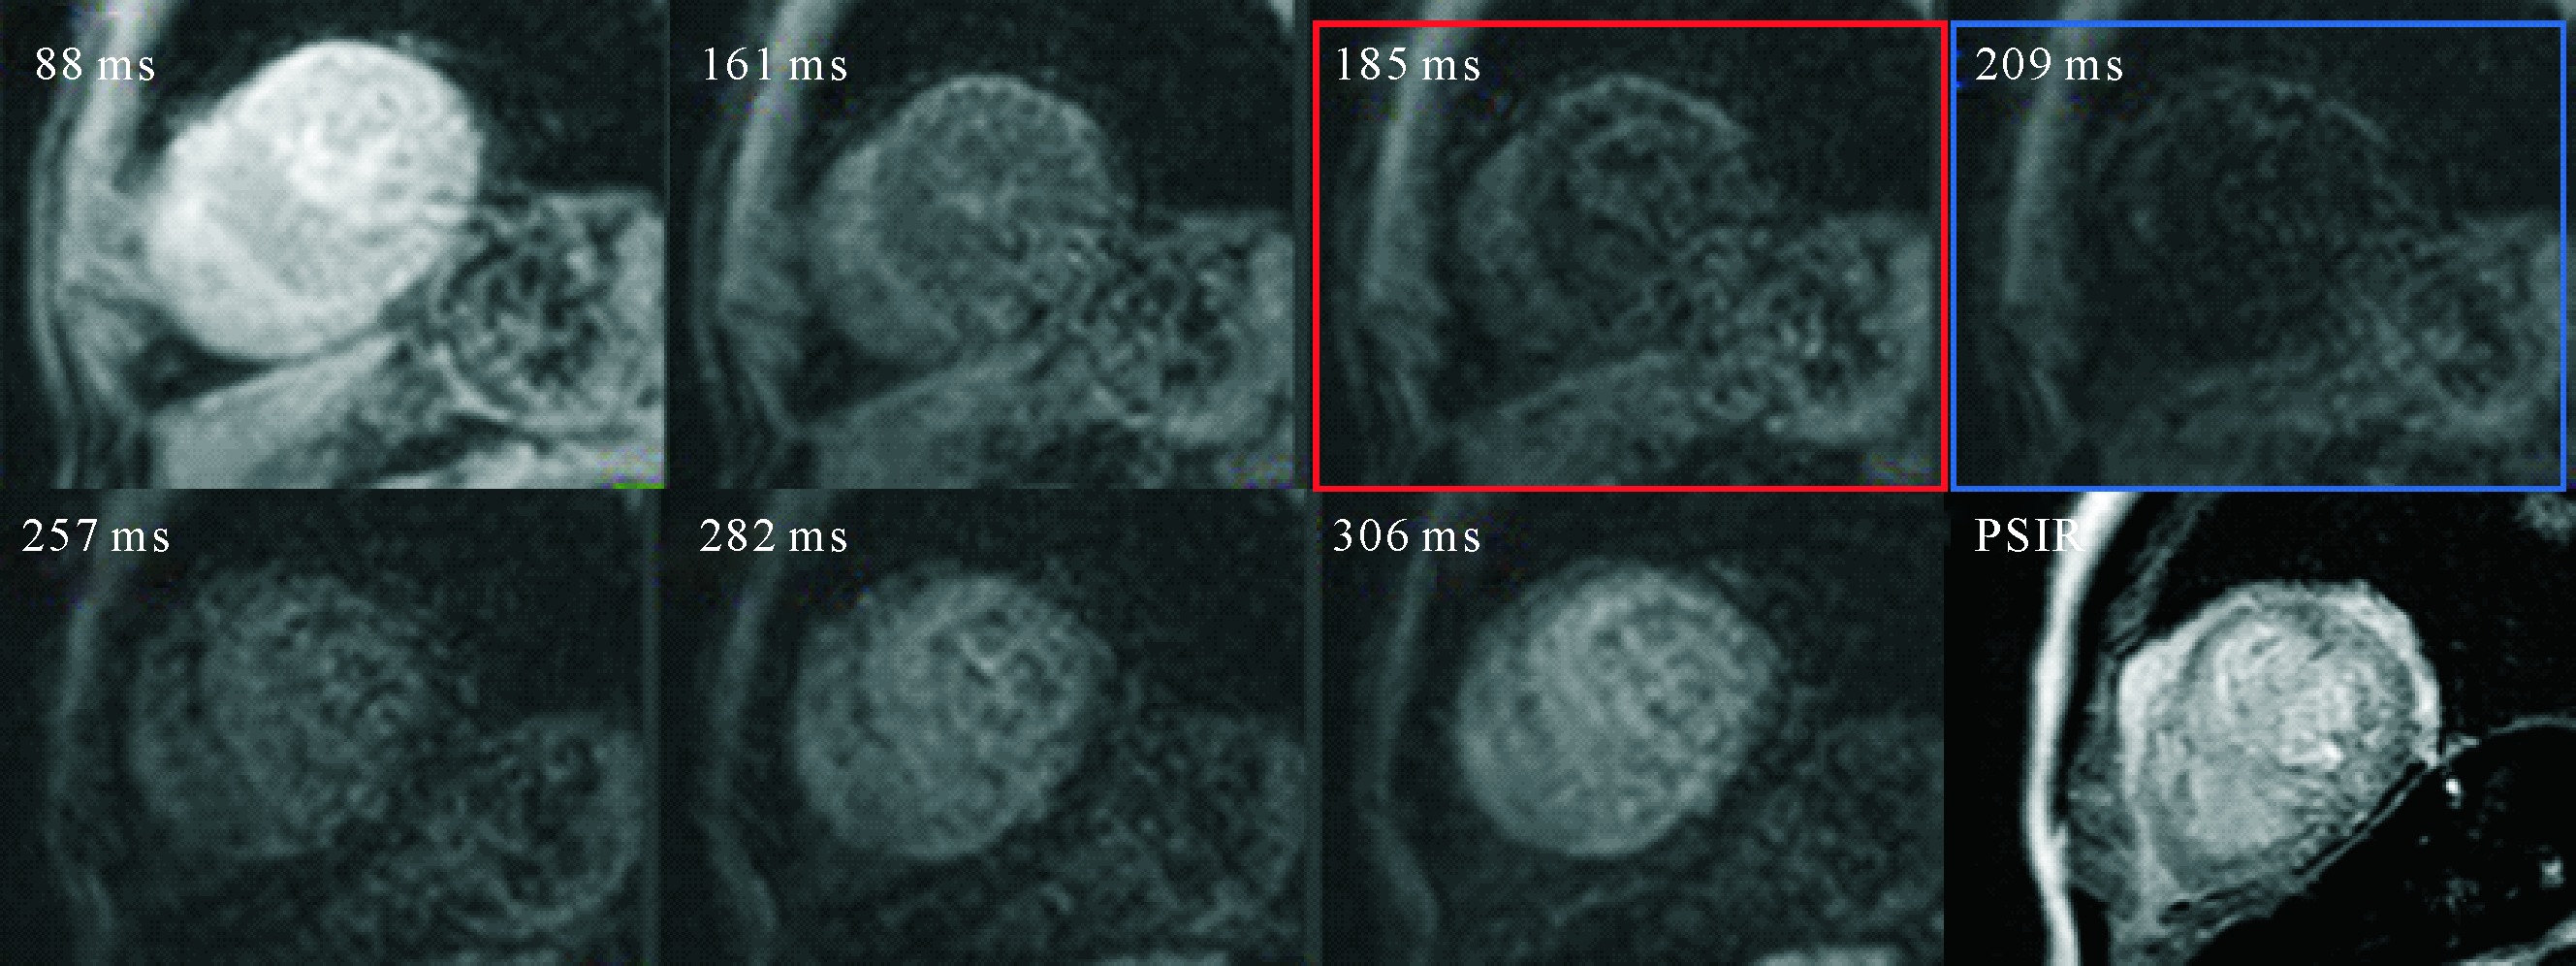
 
							
						 Figure 1 TI-scout images and PSIR images are equal in diagnostic performance A: TI-scout images of LGE-negative patient show that the blood pool reaches the null point (becomes black, blue square) before the myocardium (red square). No LGE was seen in PSIR image. B: TI-scout images of LGE-positive patient shows that diffuse myocardium reaches the null point (red square, arrow) earlier than the blood pool (blue square); PSIR image shows Transmural LGE


													Figure 1 TI-scout images and PSIR images are equal in diagnostic performance A: TI-scout images of LGE-negative patient show that the blood pool reaches the null point (becomes black, blue square) before the myocardium (red square). No LGE was seen in PSIR image. B: TI-scout images of LGE-positive patient shows that diffuse myocardium reaches the null point (red square, arrow) earlier than the blood pool (blue square); PSIR image shows Transmural LGE
												
											
										 Figure 2 The diagnostic performance of TI-scout images is superior to PSIR image in patient with subendocardial LGE TI scout images shows LGE of subendocardial myocardium reaches the null point (red square, arrow) earlier than the blood pool (blue square); PSIR image shows that the subendocardial LGE and the blood pool are poorly demarcated, which is likely to cause a “false negative” diagnosis


													Figure 2 The diagnostic performance of TI-scout images is superior to PSIR image in patient with subendocardial LGE TI scout images shows LGE of subendocardial myocardium reaches the null point (red square, arrow) earlier than the blood pool (blue square); PSIR image shows that the subendocardial LGE and the blood pool are poorly demarcated, which is likely to cause a “false negative” diagnosis
												
											
										 Figure 3 The diagnostic performance of TI-scout images and PSIR images are complementary in patients with focal patchy LGE TI scout images shows myocardium of the inferolateral wall of the left ventricle reaches the null point (red square, arrow) earlier than the blood pool (blue square), similar to suspicious LGE on short-axis PSIR


													Figure 3 The diagnostic performance of TI-scout images and PSIR images are complementary in patients with focal patchy LGE TI scout images shows myocardium of the inferolateral wall of the left ventricle reaches the null point (red square, arrow) earlier than the blood pool (blue square), similar to suspicious LGE on short-axis PSIR