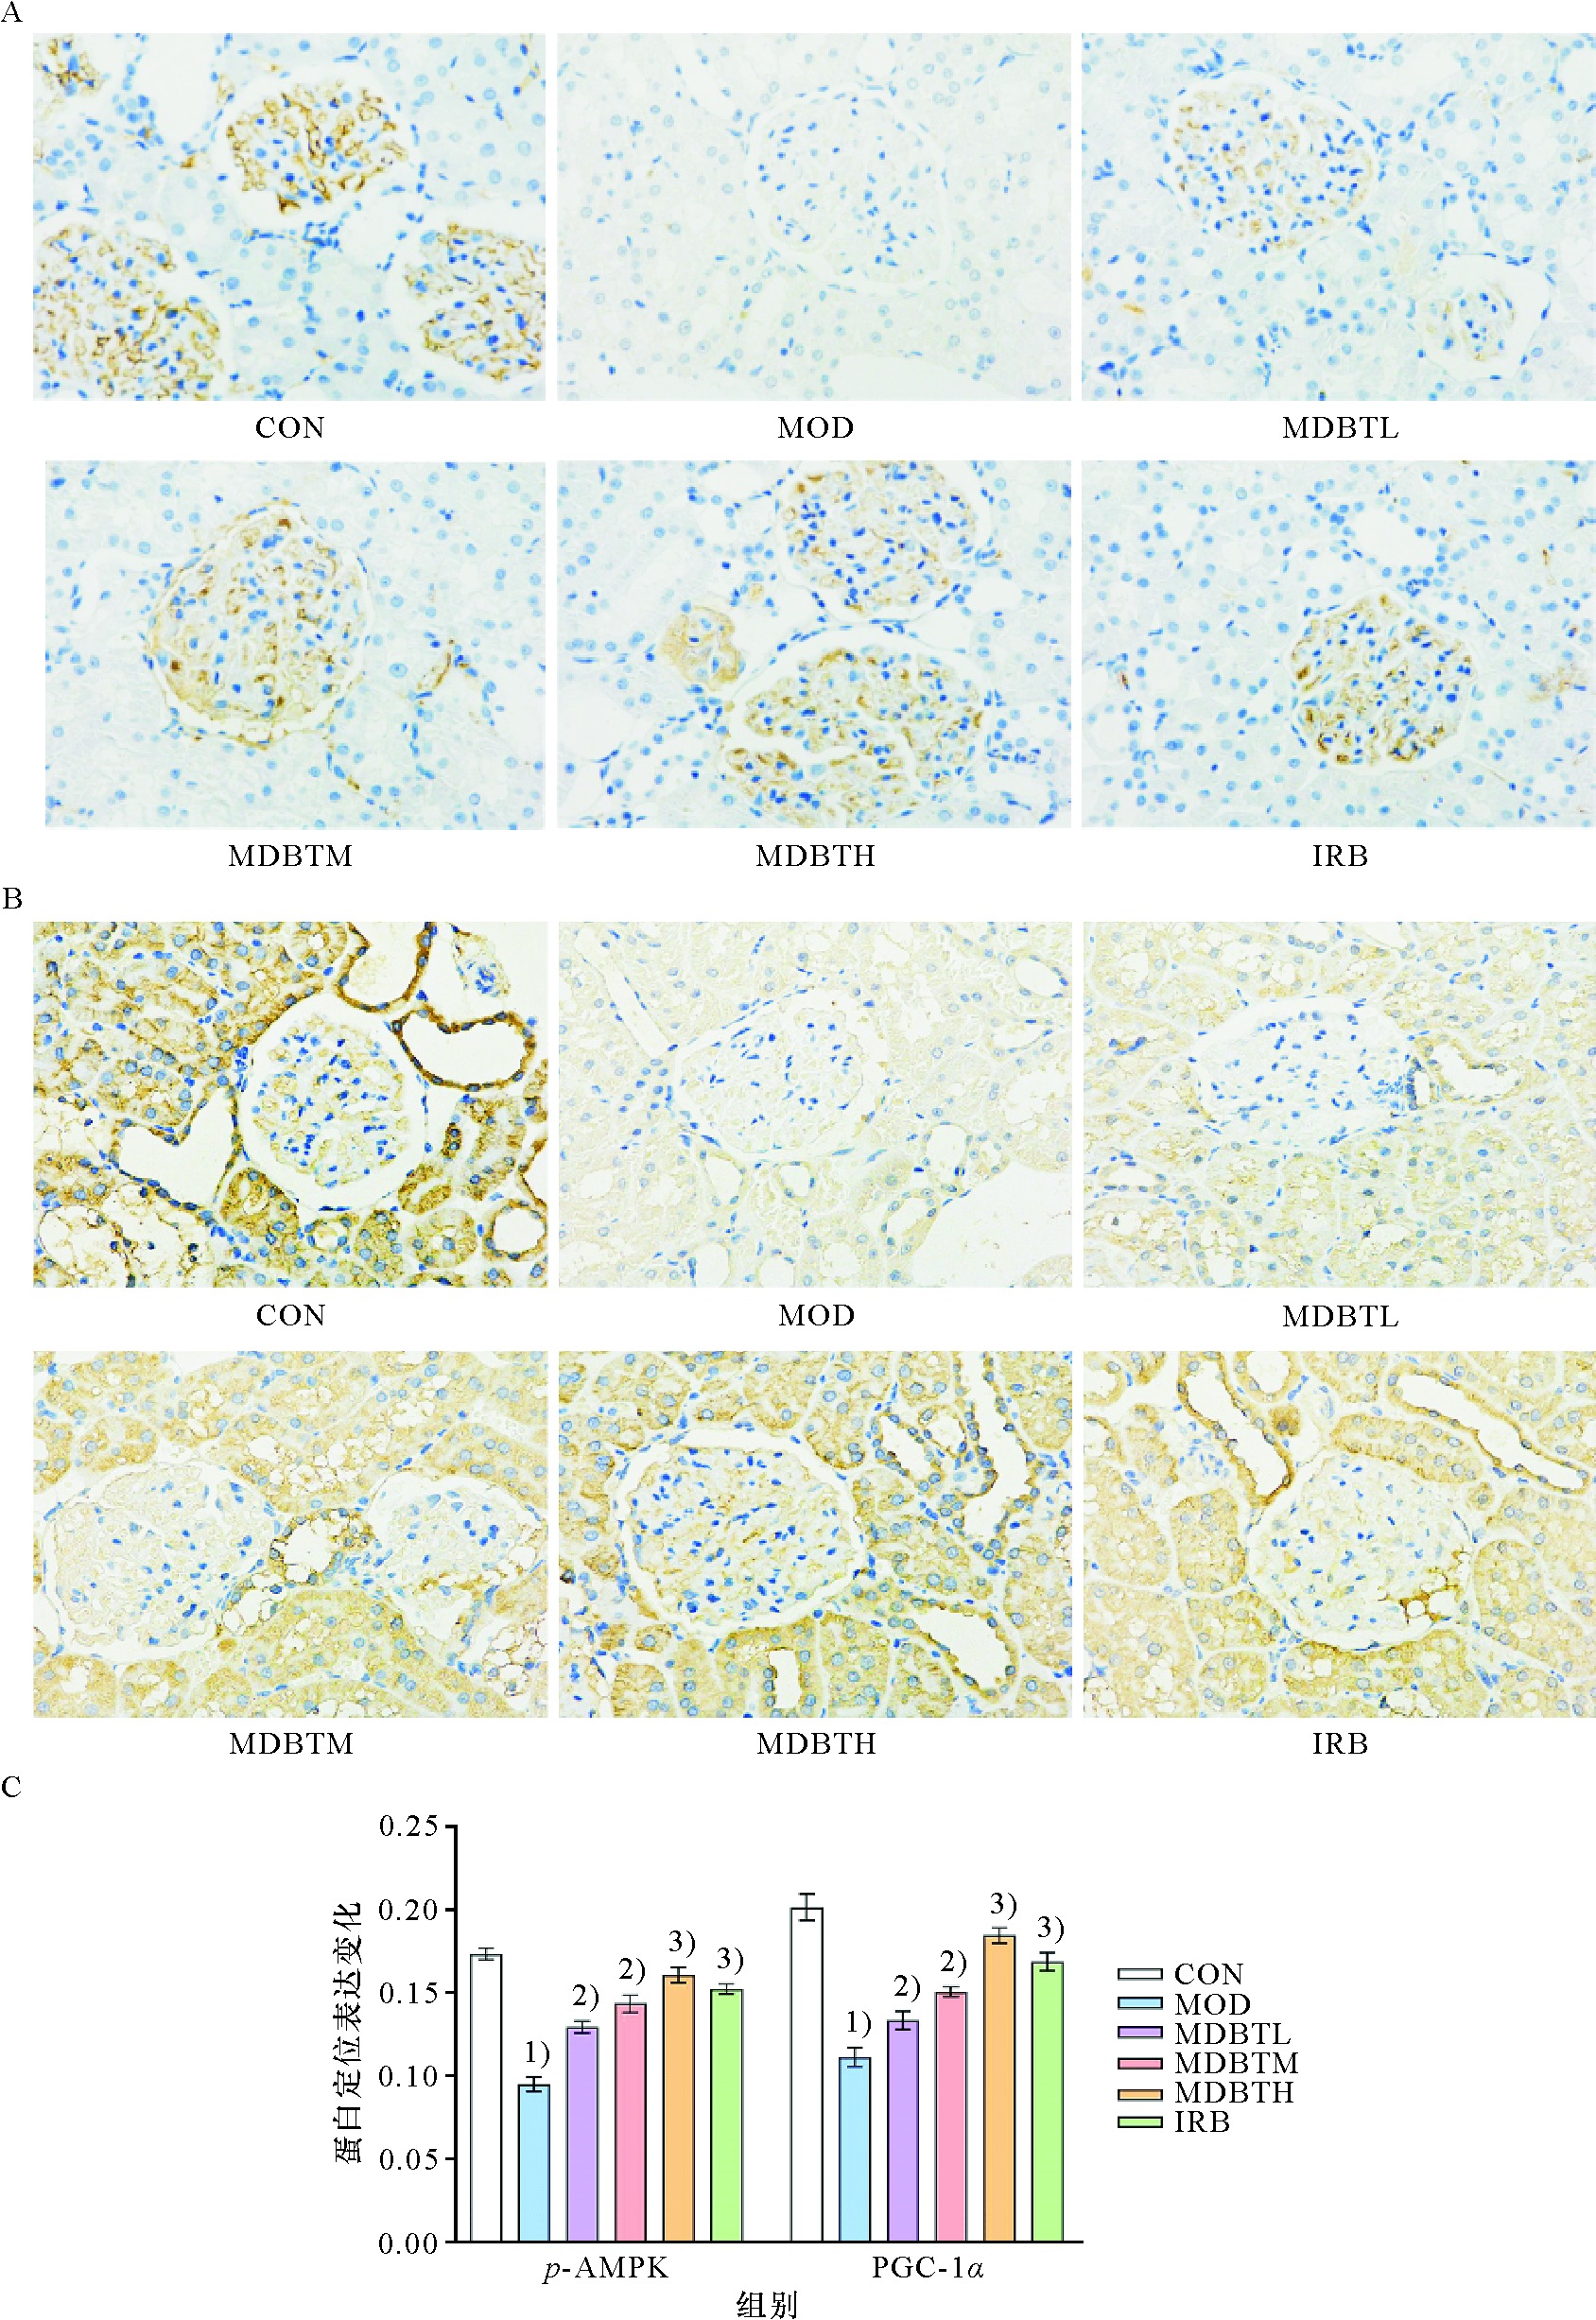
Figure 4 Effect of MDBT on pathological changes of renal tissue of DKD rats (HE, ×400) The black triangle: separation of the renal tubules from the renal sacs; The black arrow: the disappearance of the brush border of the renal tubules; The blue triangle: mesangial matrix in the glomeruli increased; The blue arrows: uniform thickening of the basement membrane within the glomeruli
Figure 5 Effect of MDBT on pathological changes of renal tissue of DKD rats (PAS, ×400) The black triangle: glycogen deposition in the glomeruli; The black arrow: the apparent disappearance of the brush edge of the renal tubules; The blue triangle: mesangial matrix in the glomeruli increased; The blue arrows: uniform thickening of the glomerular basement membrane
Figure 8 The effect of MDBT on the electrophoresis and expression of p-AMPK、PGC-1α protein in renal tissue of rats (Western blot) A: Bands of p-AMPK and PGC-1α protein electrophoresis; B: Quantization of changes of p-AMPK and PGC-1α protein expression. 1)Compared with CON group, P<0.01; 2)Compared with MOD group, P<0.05; 3)Compared with MOD group, P<0.01