×
模态框(Modal)标题
在这里添加一些文本
Close
Close
Submit
Cancel
Confirm
×
模态框(Modal)标题
×
Toggle navigation
更多内容请点击
Home
Editorial Department
About Journal
Editorial Board
Instruction
Journal Online
Just Accepted
Current Issue
Archive
Most Read
Most Download
Most Cited
E-mail Alert
RSS
Subscription
Contact Us
中文
Figure/Table detail
Analysis of oral microbiota composition in maintenance hemodialysis patients
YU Xinyuan, QIU Yufang, DAI Zhida, ZHANG Zhixiang, HU Qiaobin, ZHANG Chunlei, LIU Fanna, LI Jinghua
Journal of Jinan University Natural Science & Medicine Edition
, 2025, 46(
2
): 175-184. DOI:
10.11778/j.jdxb.20240373
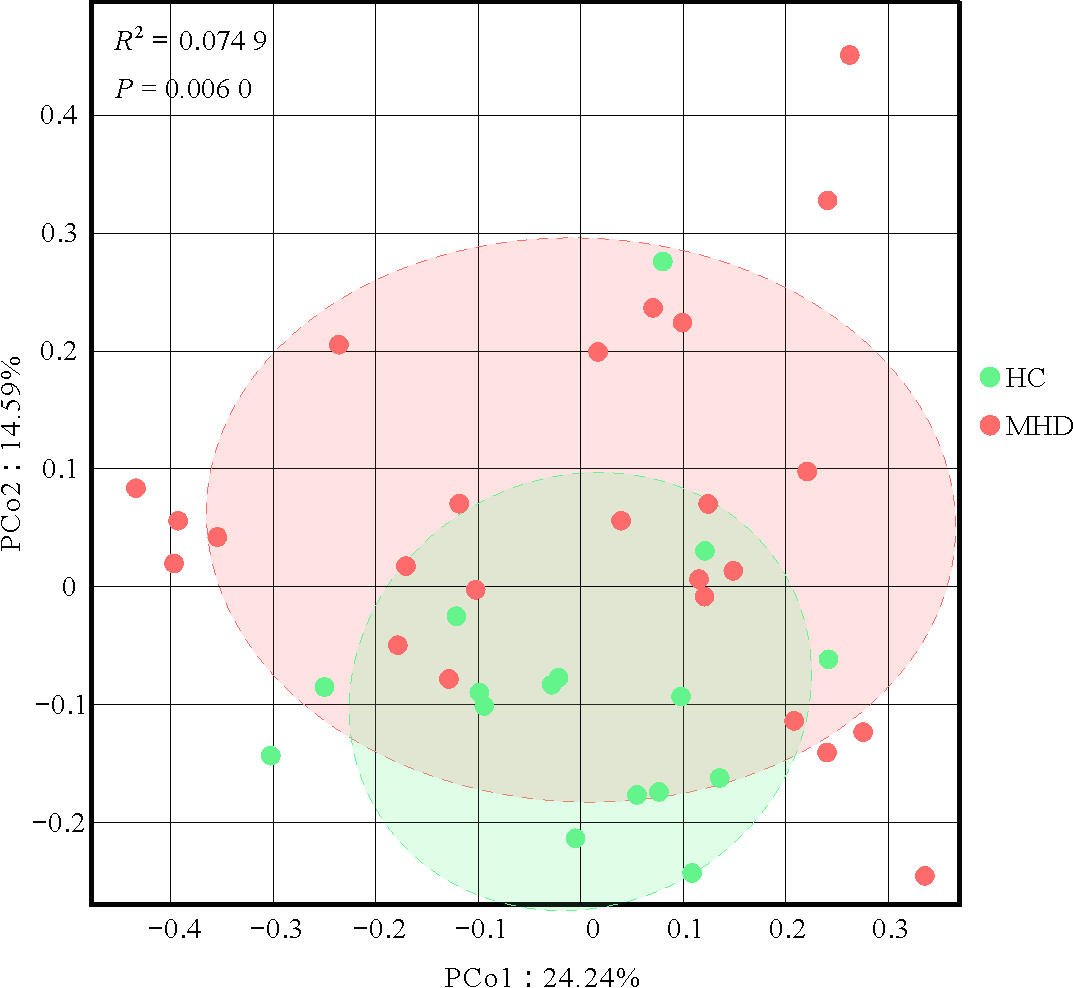
Figure 3
PCoA analysis based on Bray Curtis distance
Other figure/table from this article
Table 1
Comparison of clinical data between MHD group and HC group
Figure 1
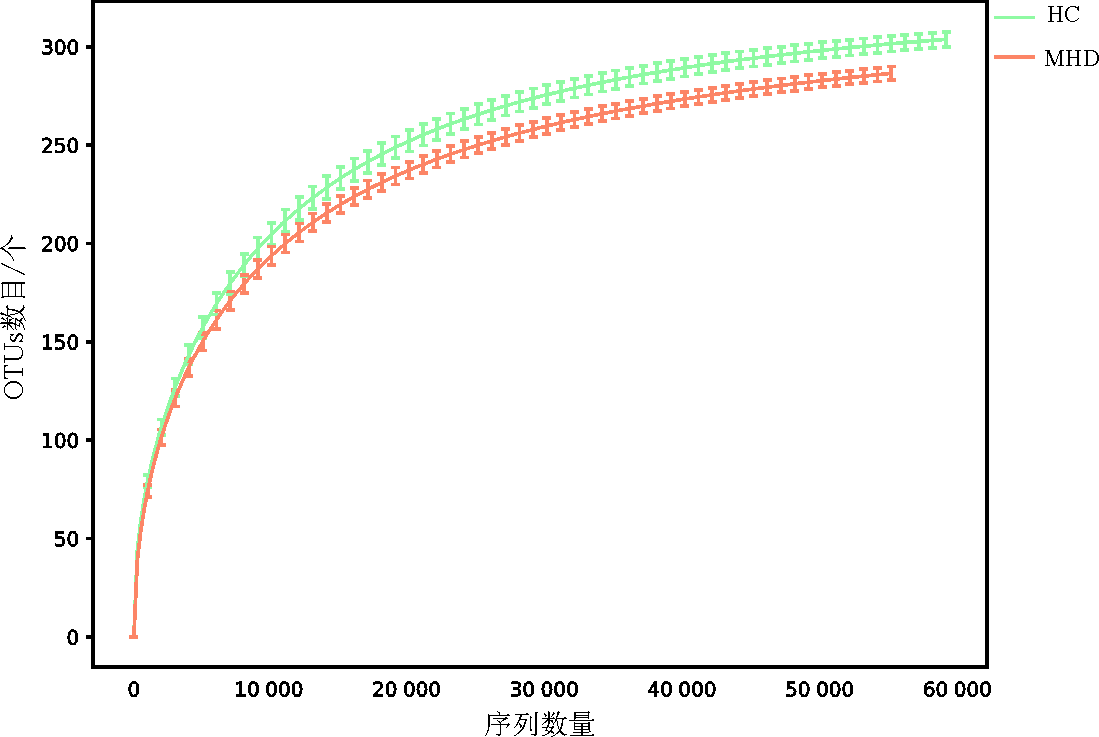
Rarefaction curve of oral microbiota in HC group and MHD group
Figure 2
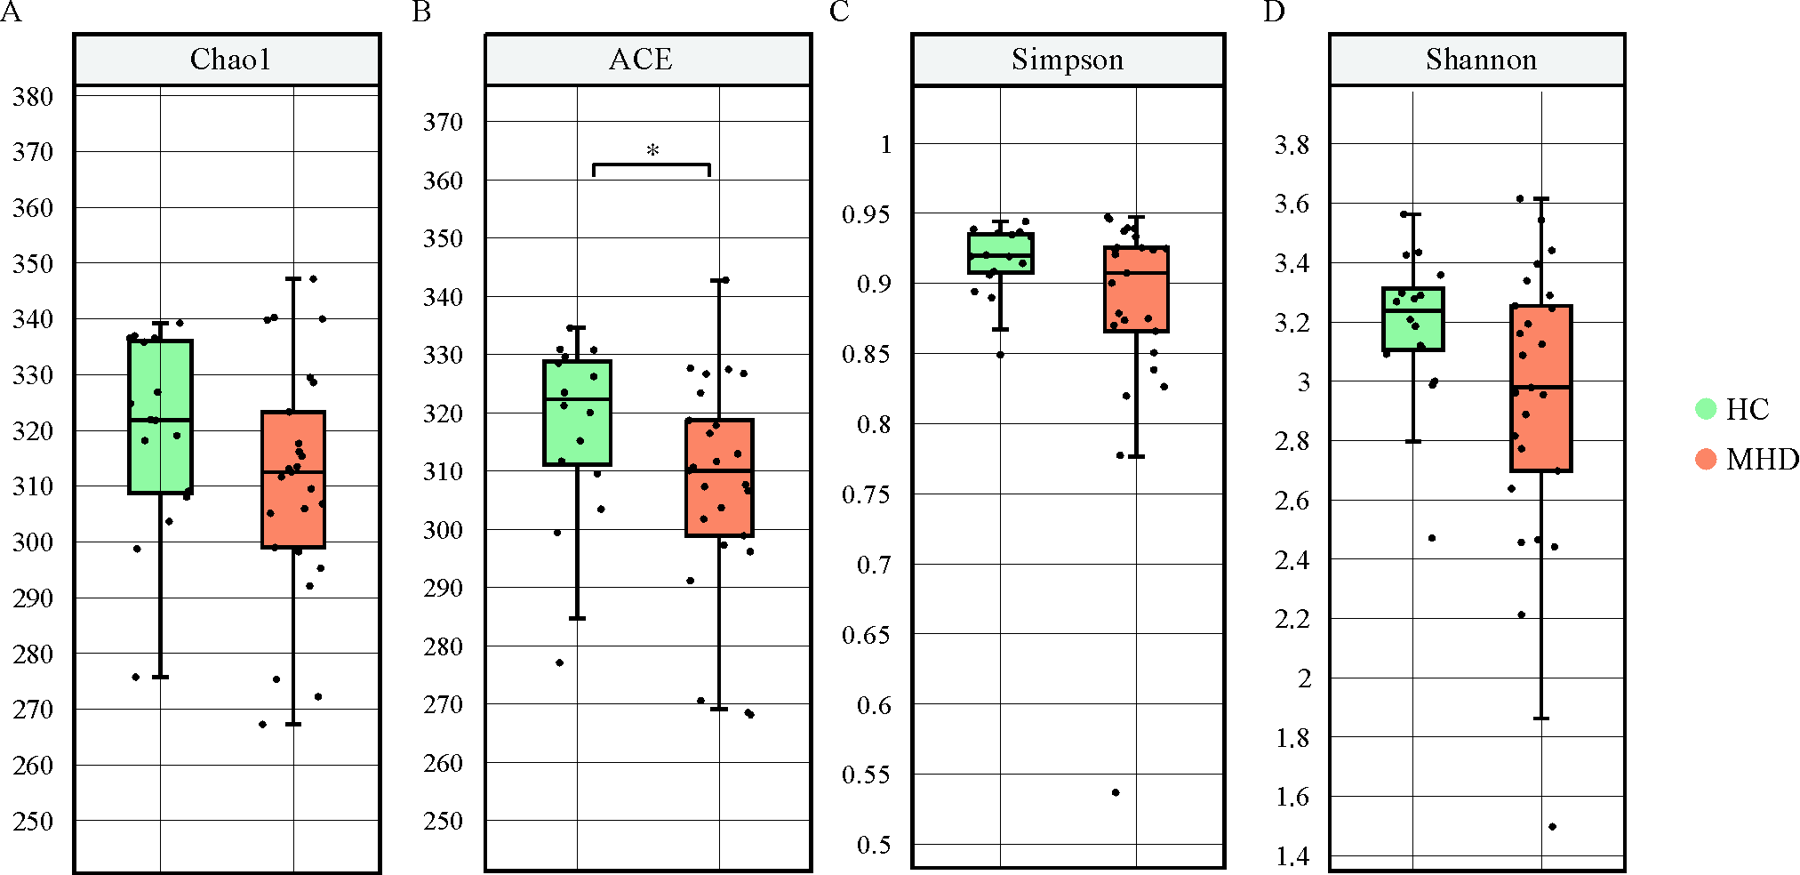
α diversity of oral microbiota in HC group and MHD group
(A)Chao1 index;(B)ACE index;(C)Simpson index;(D)Shannon index. *
P
<0.05
Figure 4
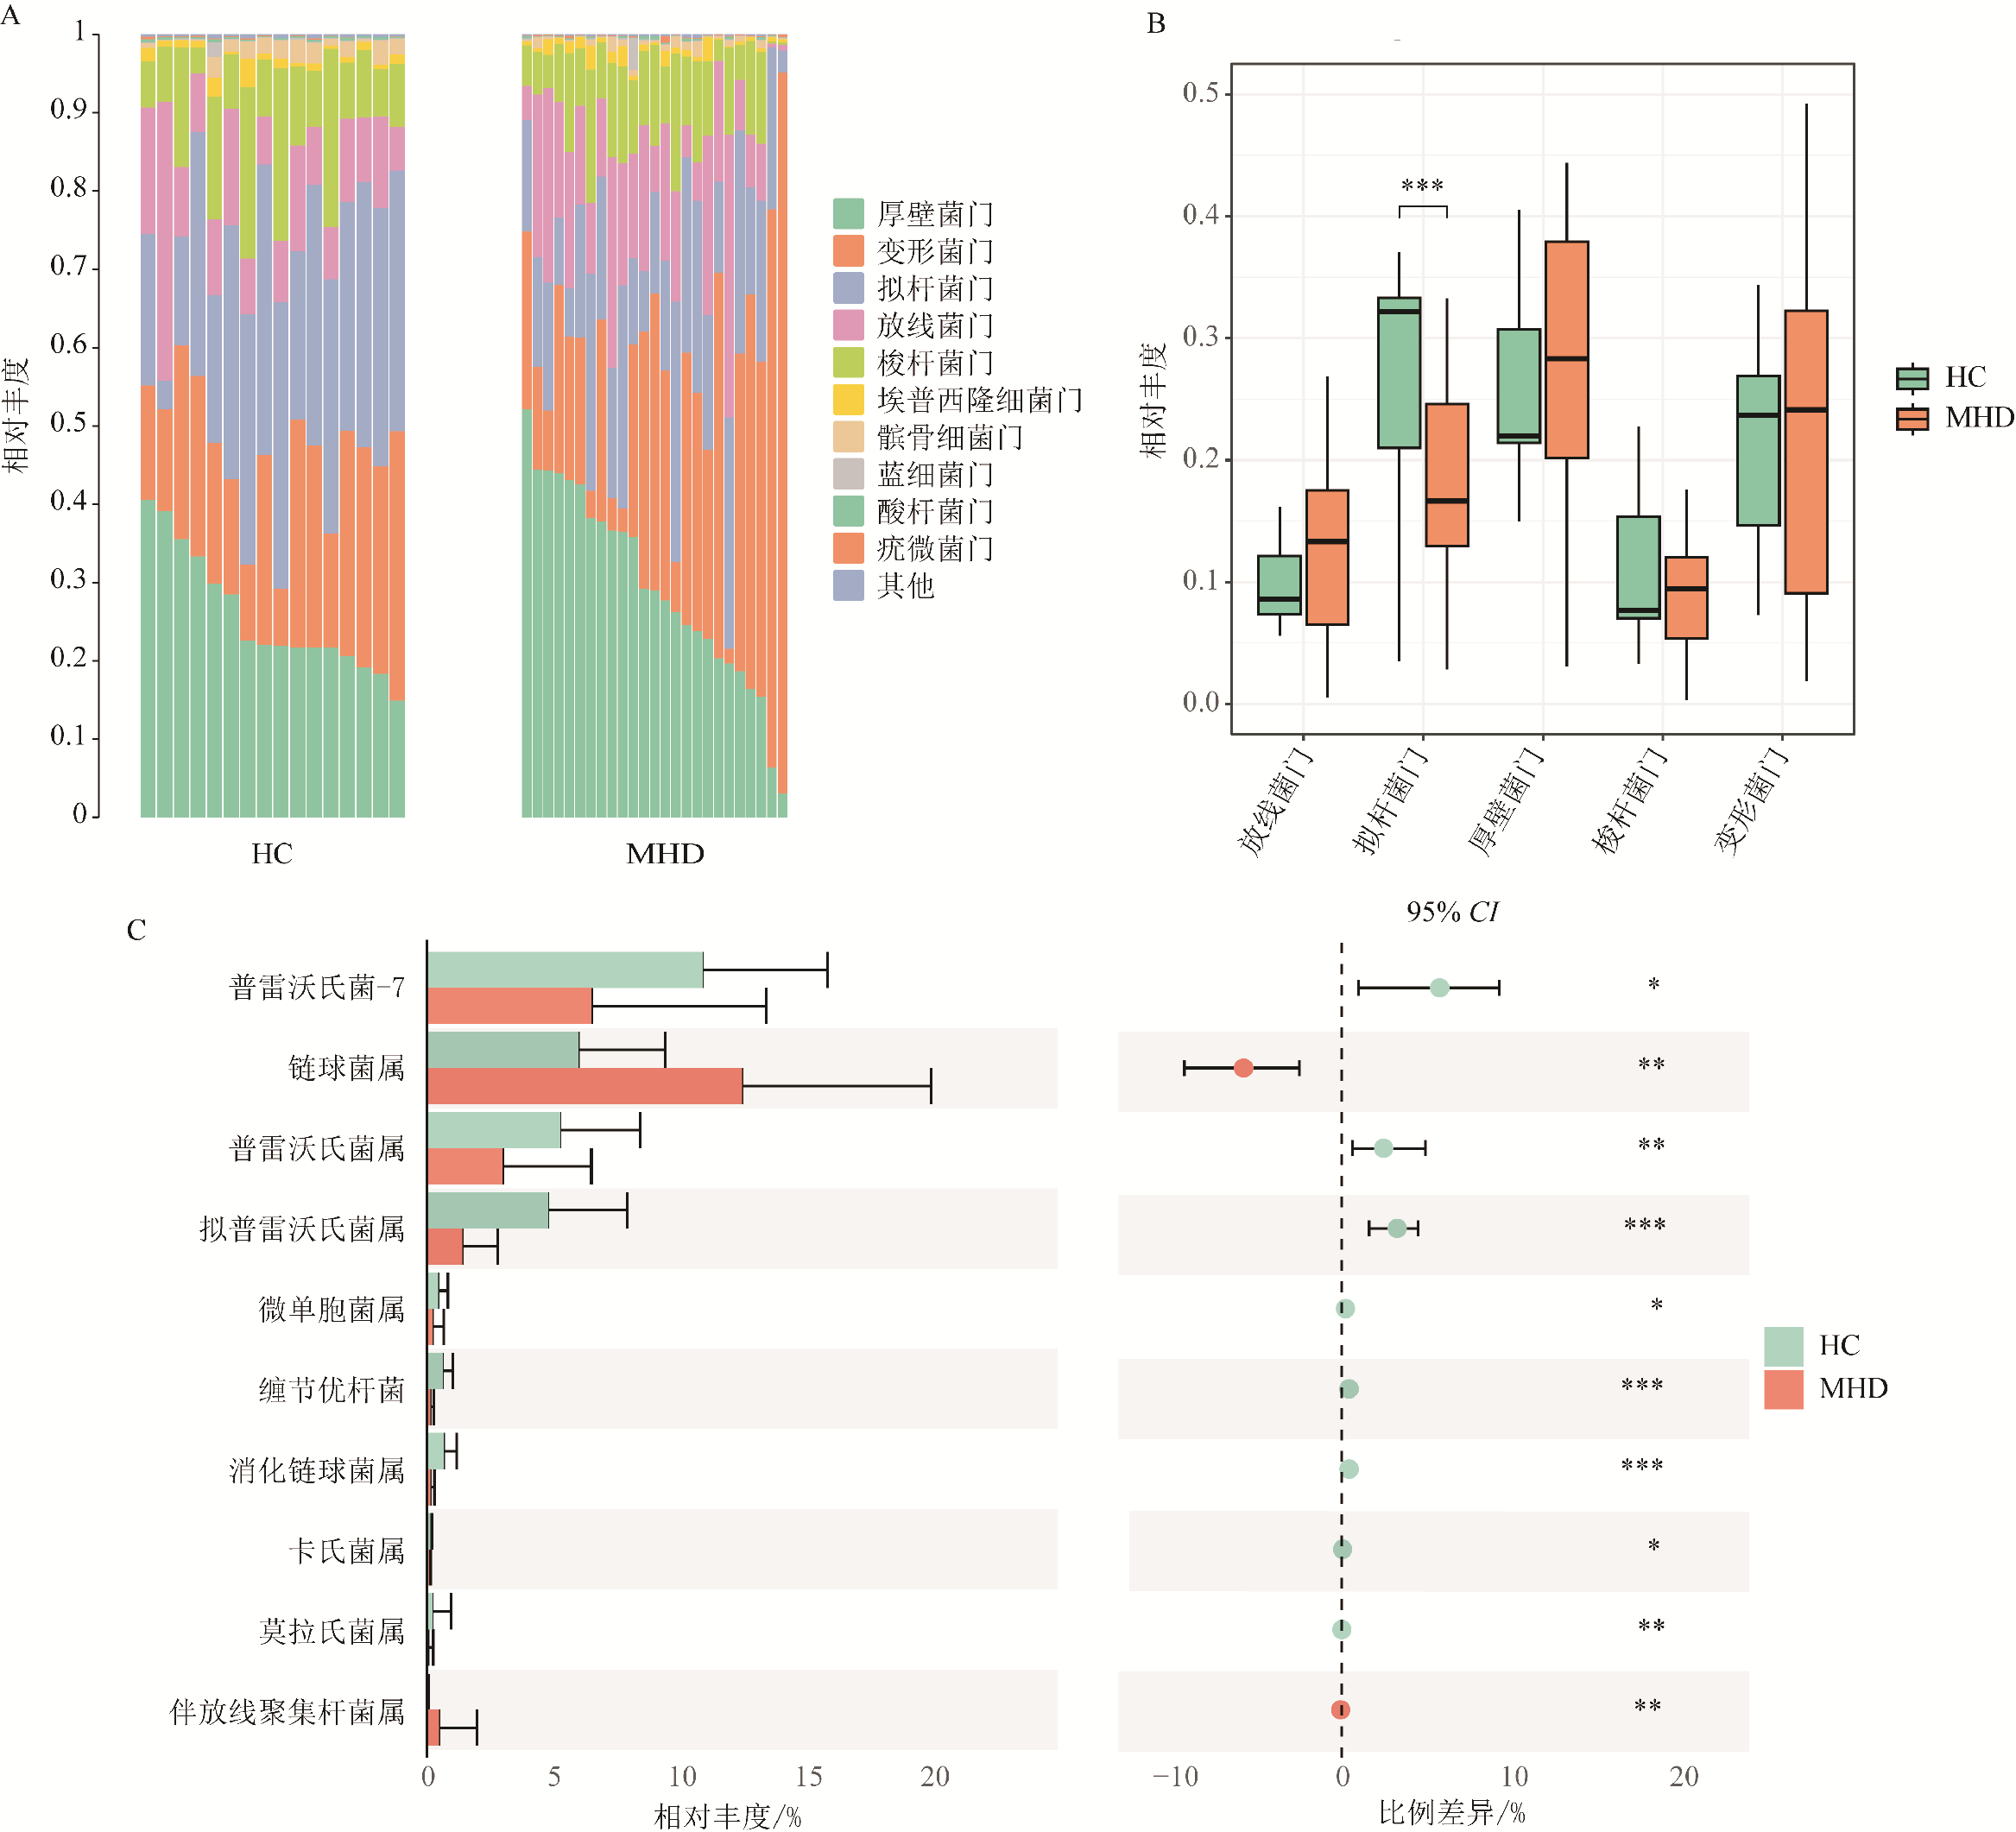
Community composition of oral microbiota in HC group and MHD group
(A)Stacked bar plot at phylum level;(B)Significance analysis between groups at phylum level;(C)Significance analysis between groups at genus level. *
P
<0.05,**
P
<0.01,***
P
<0.001
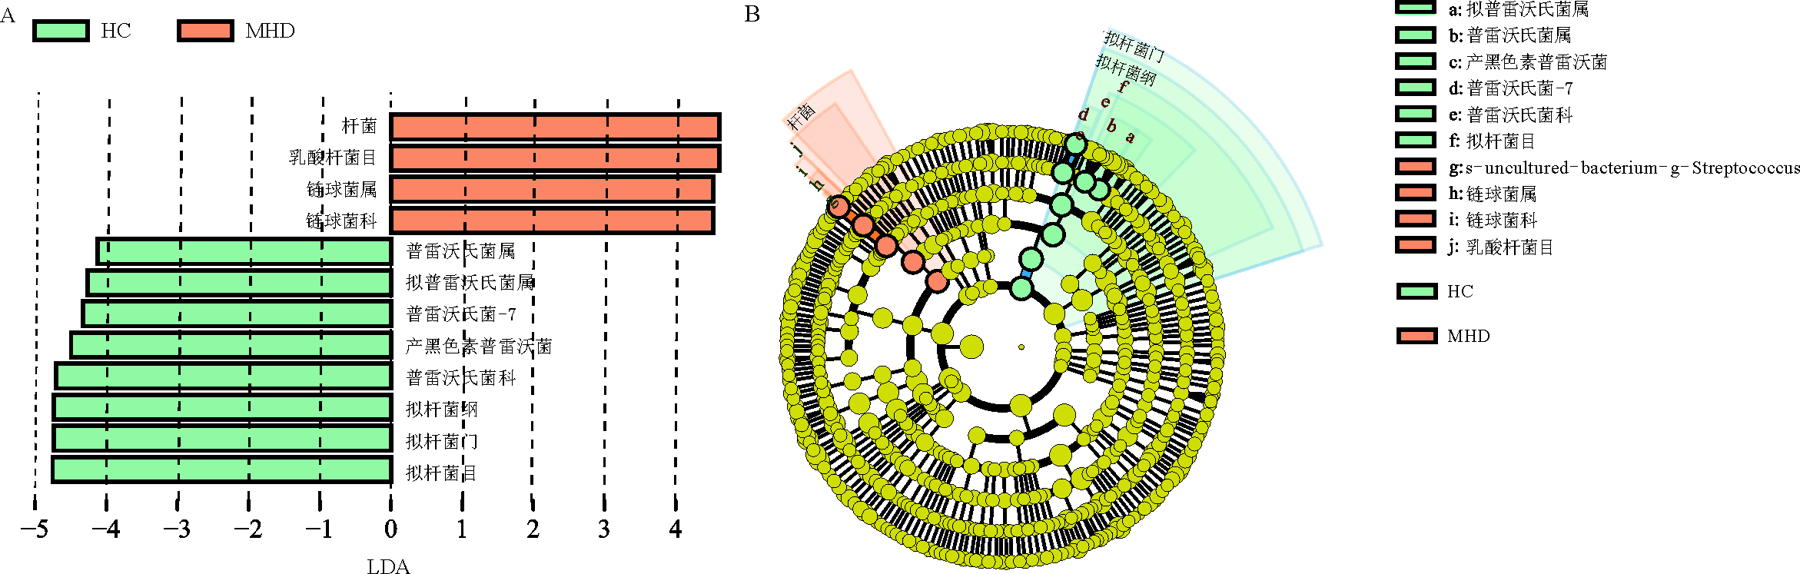
Figure 5
LEfSe analysis of oral microbiota in HC group and MHD group
(A)Histogram of LDA value distribution of oral microbiota (The length of the bar chart represents the impact size of the differential species); (B)Cladogram of oral microbiota (The circles radiating from the center represent the taxonomic ranks from phylum to species, with the nodes representing a classification at that level. Different colors indicate different groups, with non-significant species colored yellow, and significant species colored according to their respective groups).
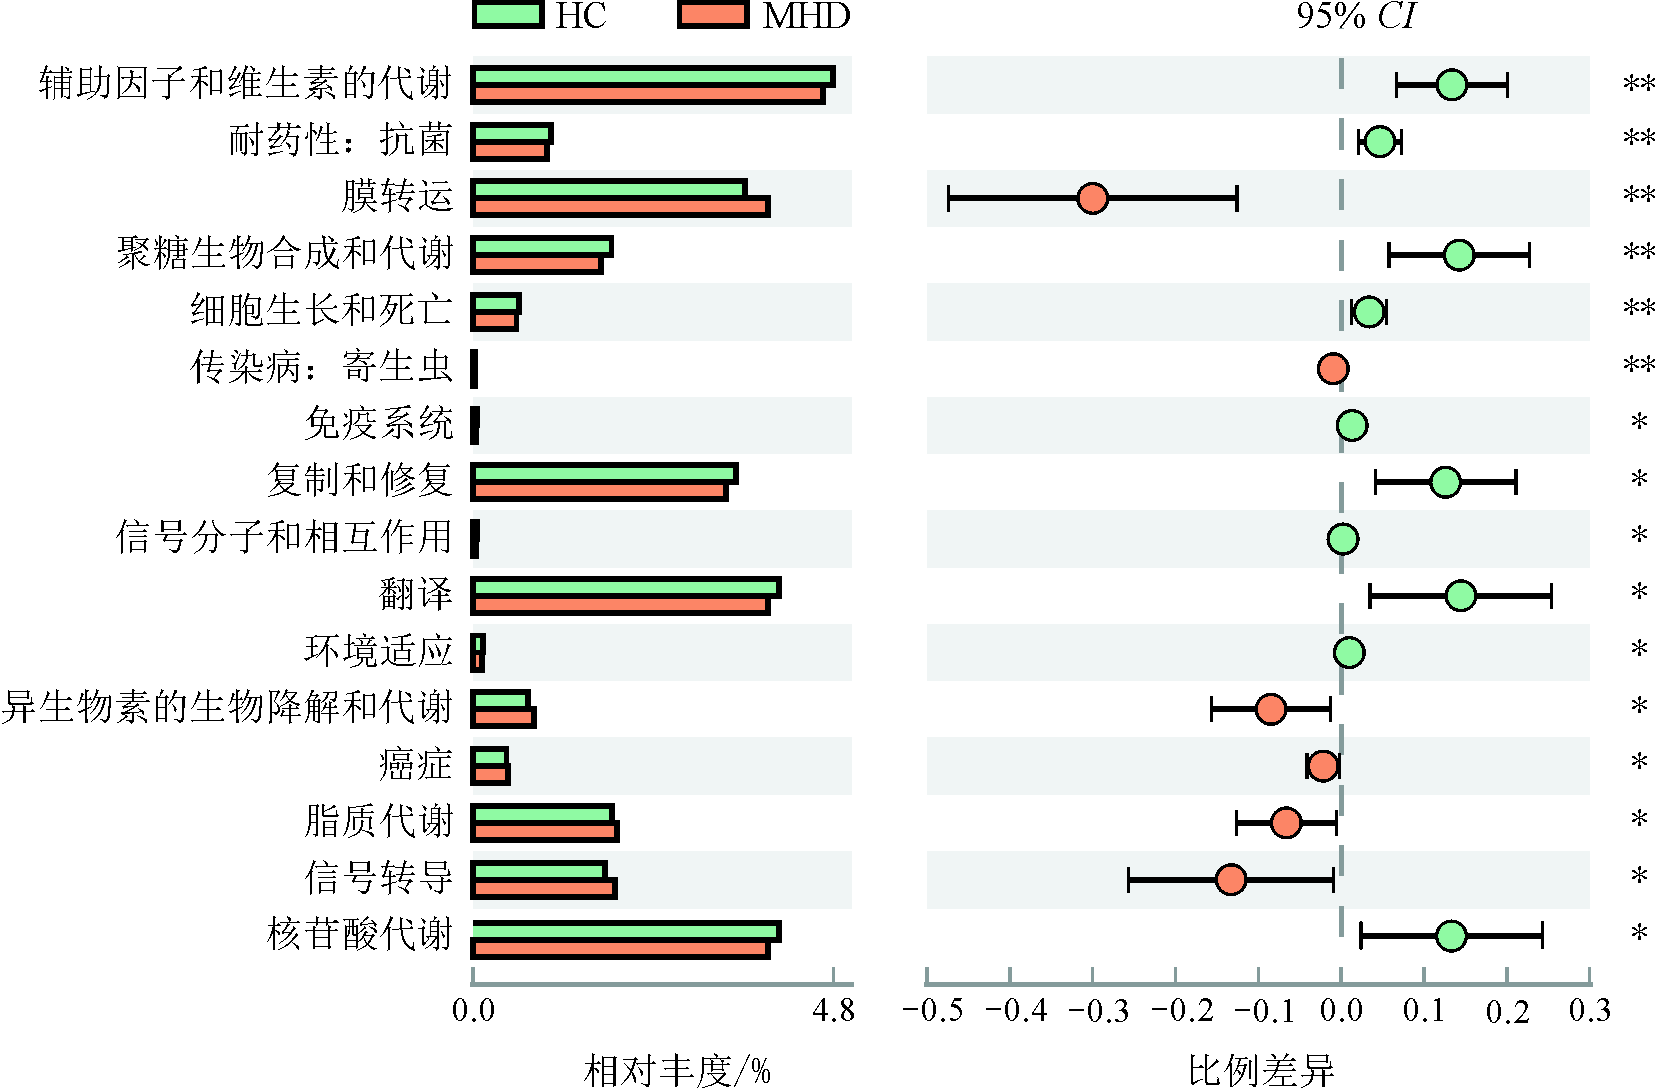
Figure 6
Prediction of oral microbiota function in HC group and MHD group
*
P
<0.05,**
P
<0.01
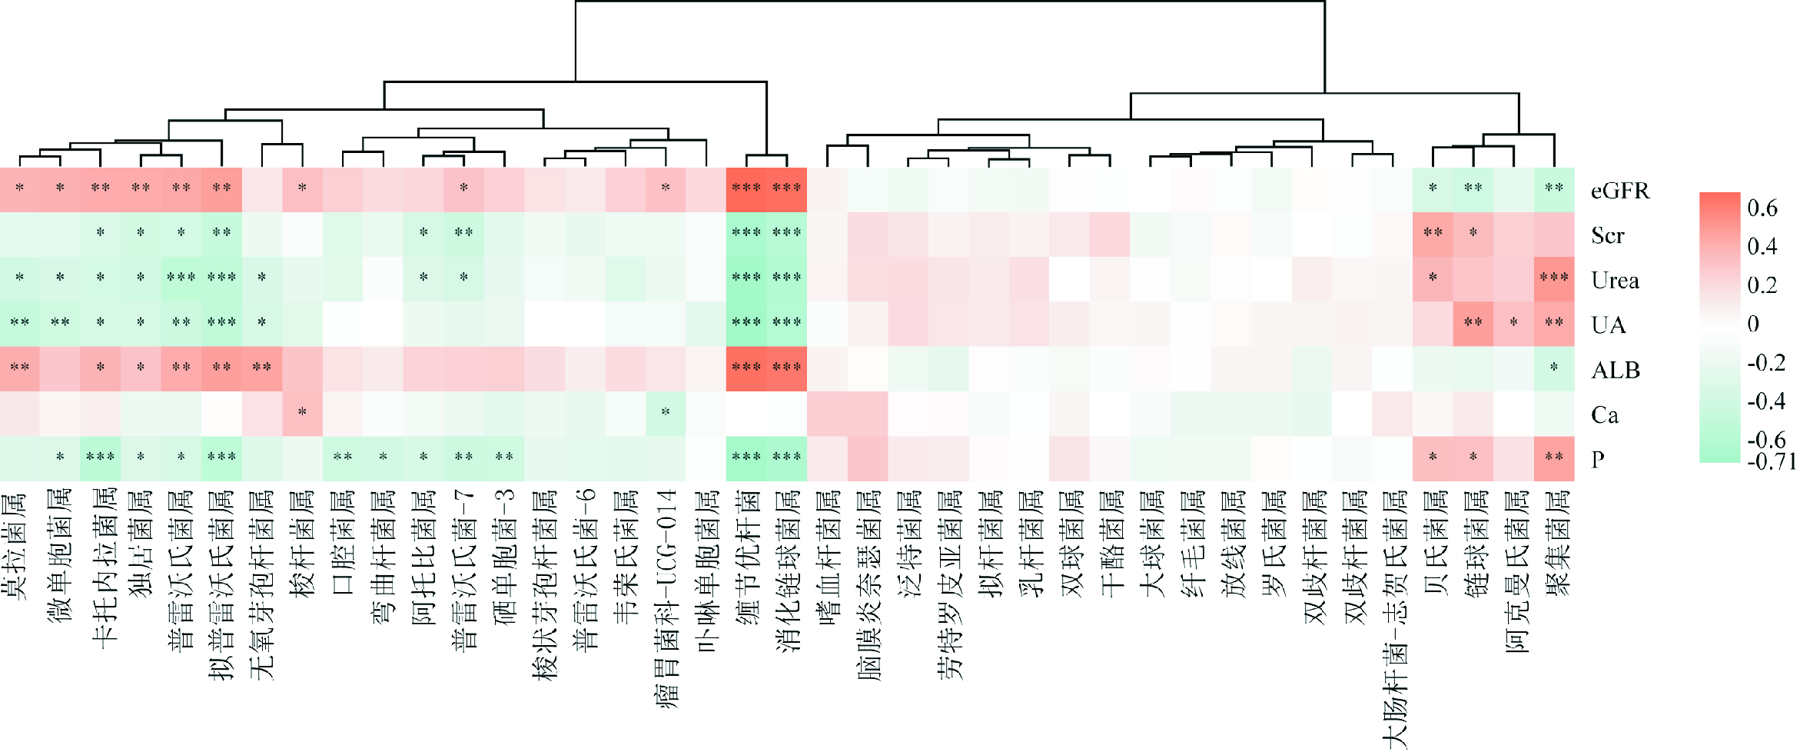
Figure 7
Spearman correlation analysis between oral microbiota and clinical parameters
*
P
<0.05,**
P
<0.01,***
P
<0.001


 粤ICP备12087612号