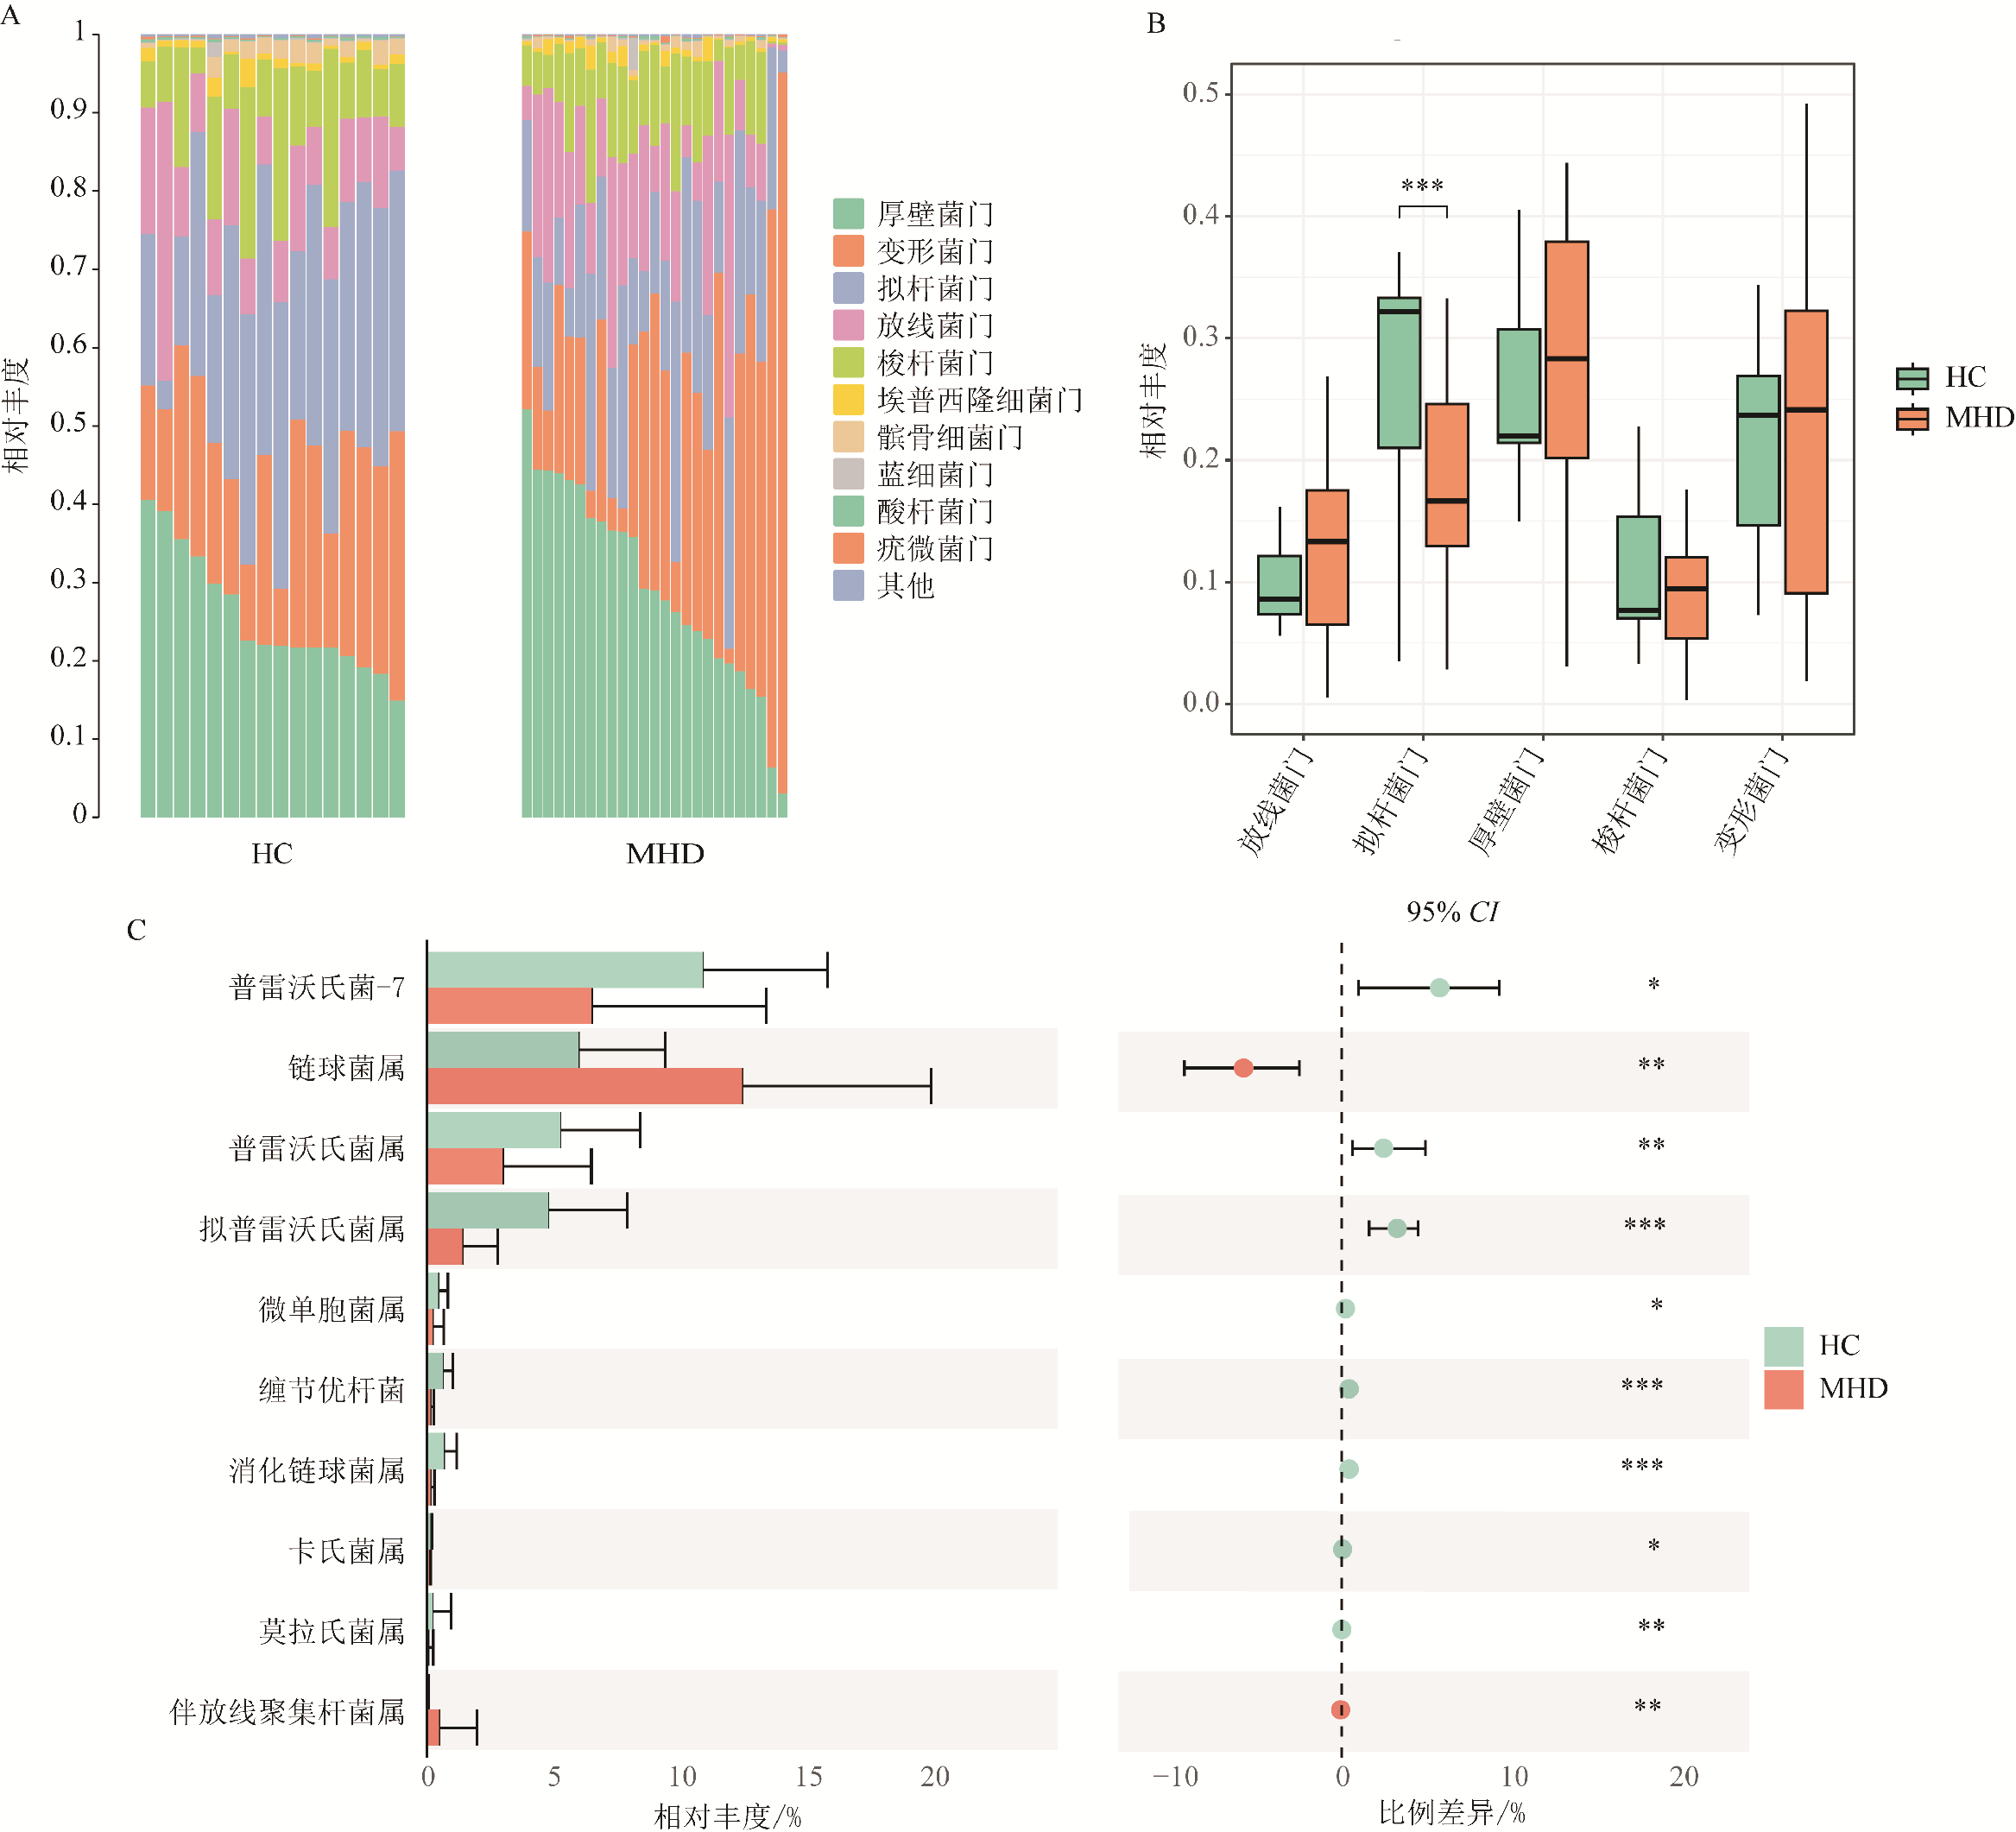
Figure 4 Community composition of oral microbiota in HC group and MHD group (A)Stacked bar plot at phylum level;(B)Significance analysis between groups at phylum level;(C)Significance analysis between groups at genus level. *P<0.05,**P<0.01,***P<0.001
Other figure/table from this article


 粤ICP备12087612号