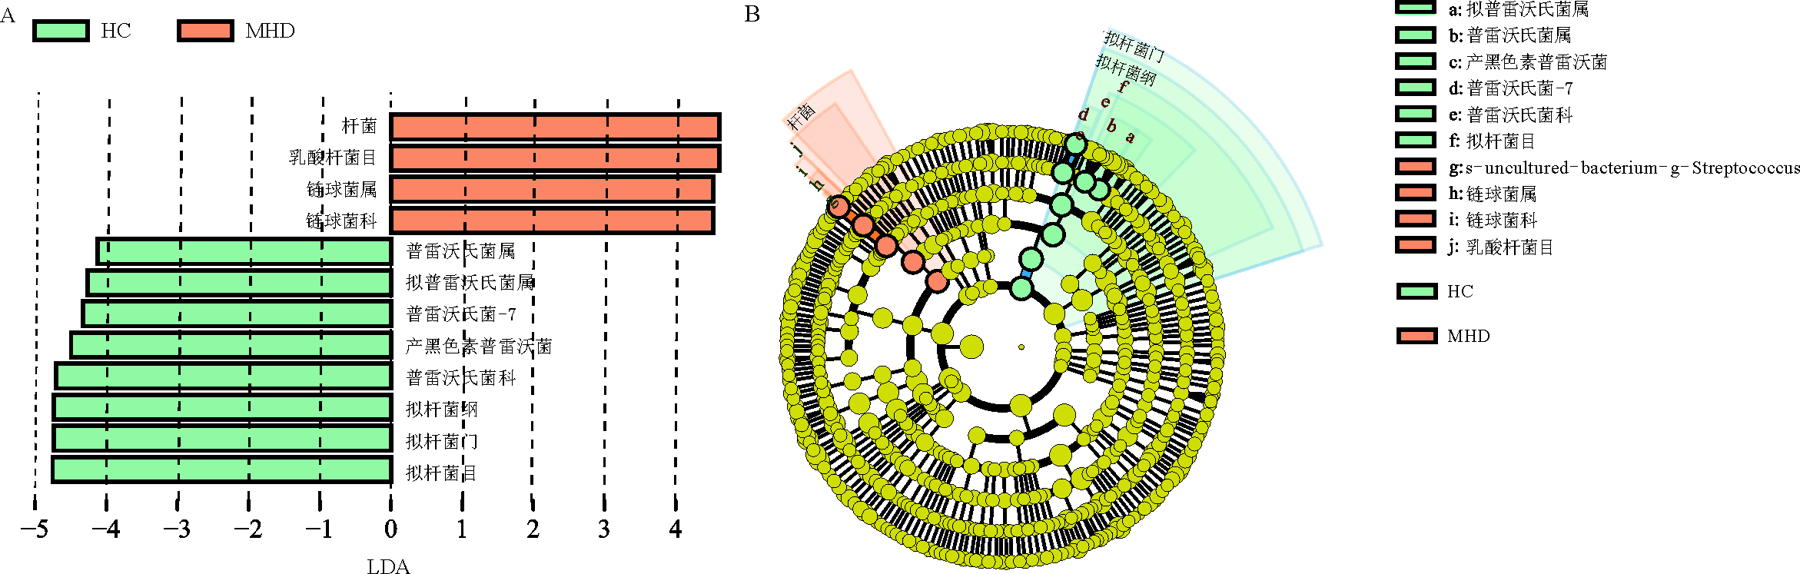
Figure 5 LEfSe analysis of oral microbiota in HC group and MHD group (A)Histogram of LDA value distribution of oral microbiota (The length of the bar chart represents the impact size of the differential species); (B)Cladogram of oral microbiota (The circles radiating from the center represent the taxonomic ranks from phylum to species, with the nodes representing a classification at that level. Different colors indicate different groups, with non-significant species colored yellow, and significant species colored according to their respective groups).
Other figure/table from this article


 粤ICP备12087612号