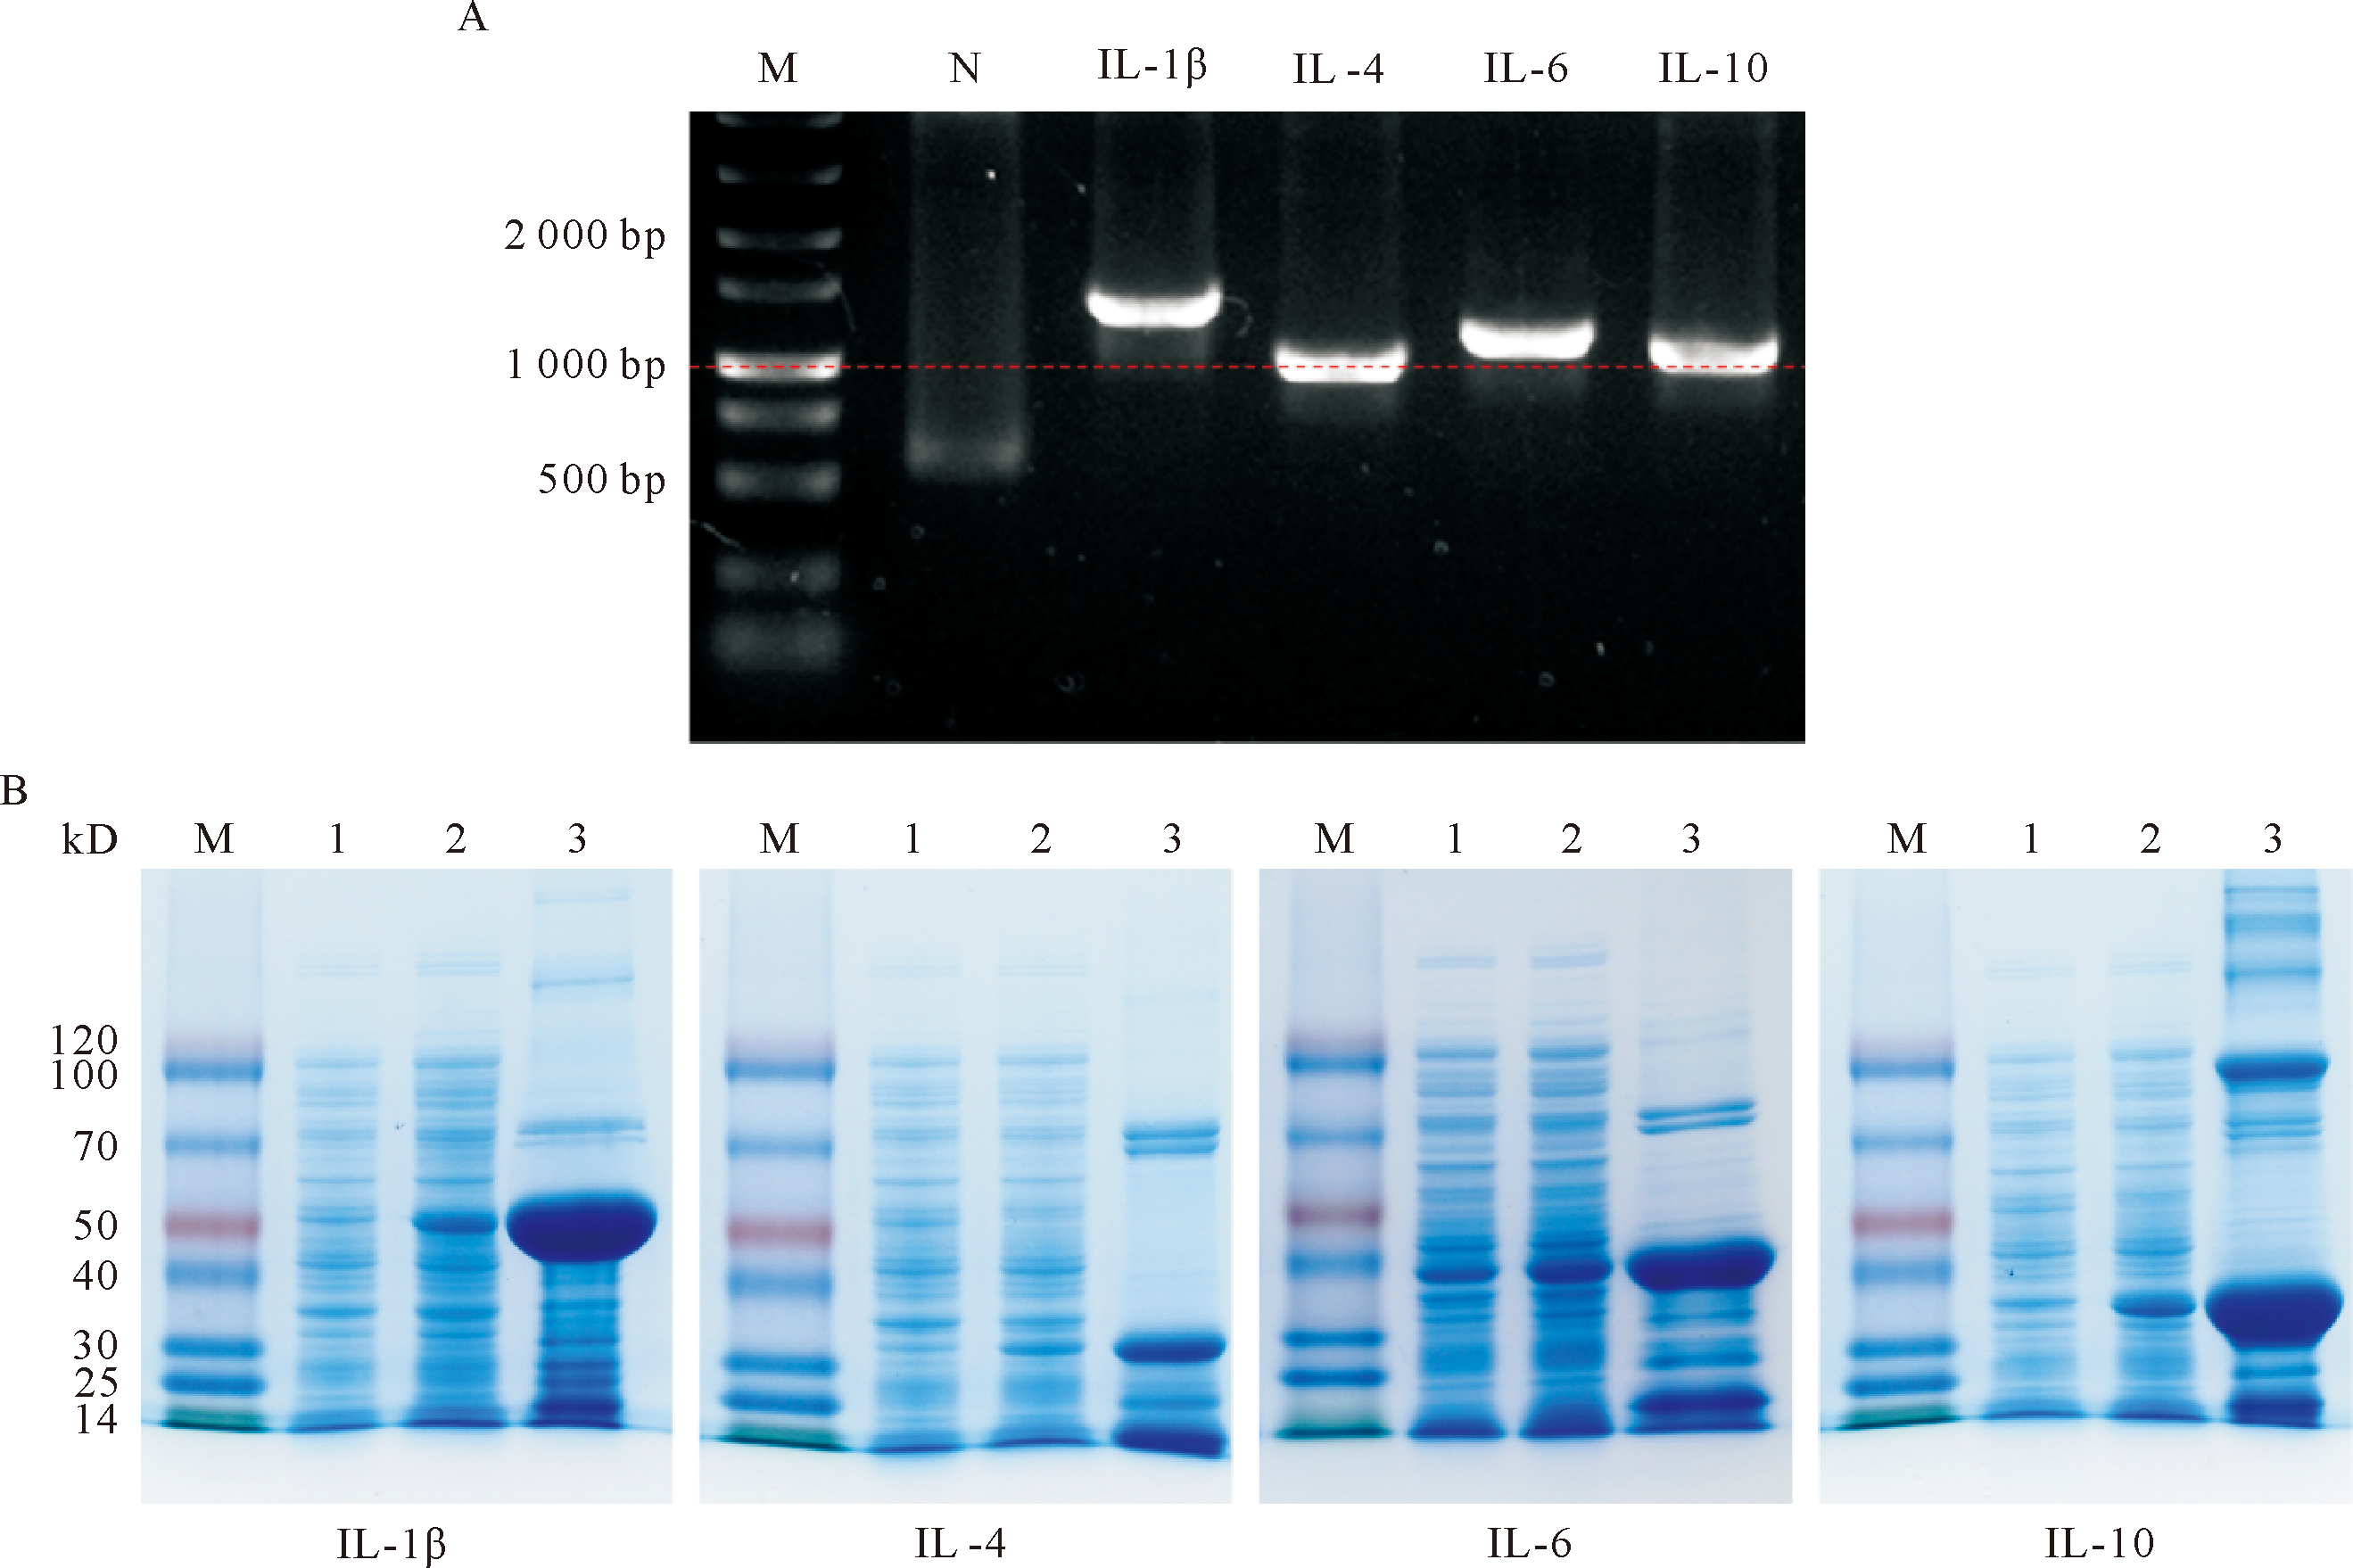
| 引物名称 | 上游引物 | 下游引物 |
|---|---|---|
| UTR | 5’-GCGTCGACACTAGTTCTAGACCCTCATTGGACCCTCGTA-CAGAAGCTAATACGACTCACTATAGGGAAATAAGAGAGA-AAAGAAGAGTAAGAAGAAATATAAGAGCCACCATGTCTC-GCCAGTCAAG-3’ | 5’-GCGTCGACACTAGTTCTAGACCCTCACTTCCTACTCAGGC-TTTATTCAAAGACCAAGAGGTACAGGTGCAAGGGAGAGAA-GAAGGGCATGGCCAGAAGGCAAGCCCCGCAGAAGGCAGCT-TAGCTCTTGAAGCTCTT-3’ |
| Tail PCR | 5’-TTGGACCCTCGTACAGAAGCTAATACG-3’ | 5’-T(120)CTTCCTACTCAGGCTTTATTCAAAGACCA-3’ |
Figure 1 Identification of target gene prokaryotic expression A: PCR identification of prokaryotic expression plasmid. The lanes were sequentially DNA Marker, plasmid PCR products without inserting the target gene, and recombinant plasmid PCR products containing IL-1β, IL-4, IL-6, and IL-10 protein coding regions; B: SDS-PAGE identification of His tag target protein. Lane 1 was the uninduced bacterial liquid, lane 2 was the induced bacterial liquid, and lane 3 was the purified protein. The molecular weights of His labeled proteins of IL-1β, IL-4, IL-6, and IL-10 were 45.07, 31.82, 38.04 and 34.84 kD.
Figure 2 Krt5 mRNA was synthesized in vitro and expressed in transfected PAC2 cells A: Electrophoretic Results of Intermediate Products of Krt5 mRNA Synthesized in Vitro. Lane 1 is the PCR product of Krt5 gene, lane 2 is the PCR product with added UTR sequence, and lane 3 is the PCR product with poly(T) tail; B: Western blot detection of Krt5 expression in PAC2 cells.
Figure 3 Overexpressed Krt5 promotes the formation of filopodia in PAC2 cells The green fluorescence shows the Alexa Fluor 488-Phalloidin stained F-actin, the red fluorescence shows the location of Krt5 in the cell, the blue fluorescence shows the DAPI stained nucleus, and the white arrow indicates the filopodia.
Figure 4 Effects of overexpression of Krt5 on the migration ability of PAC2 cells A: Effects of overexpression of Krt5 at different mass concentration on the migration ability of PAC2 cells; B: Comparison of the corresponding scratch area and healing rate at each time point. 1) Compared with the Control group, P<0.05.
Figure 5 Relative expression levels of differential genes in KEGG pathway after Krt5 overexpression A: TGF-β receptor gene expression changes after Krt5 overexpression; B: KEGG enriched differential gene expression changes after Krt5 overexpression; C: Interleukin-receptor gene expression changes after Krt5 overexpression. 1)Compared with group A, P<0.01.