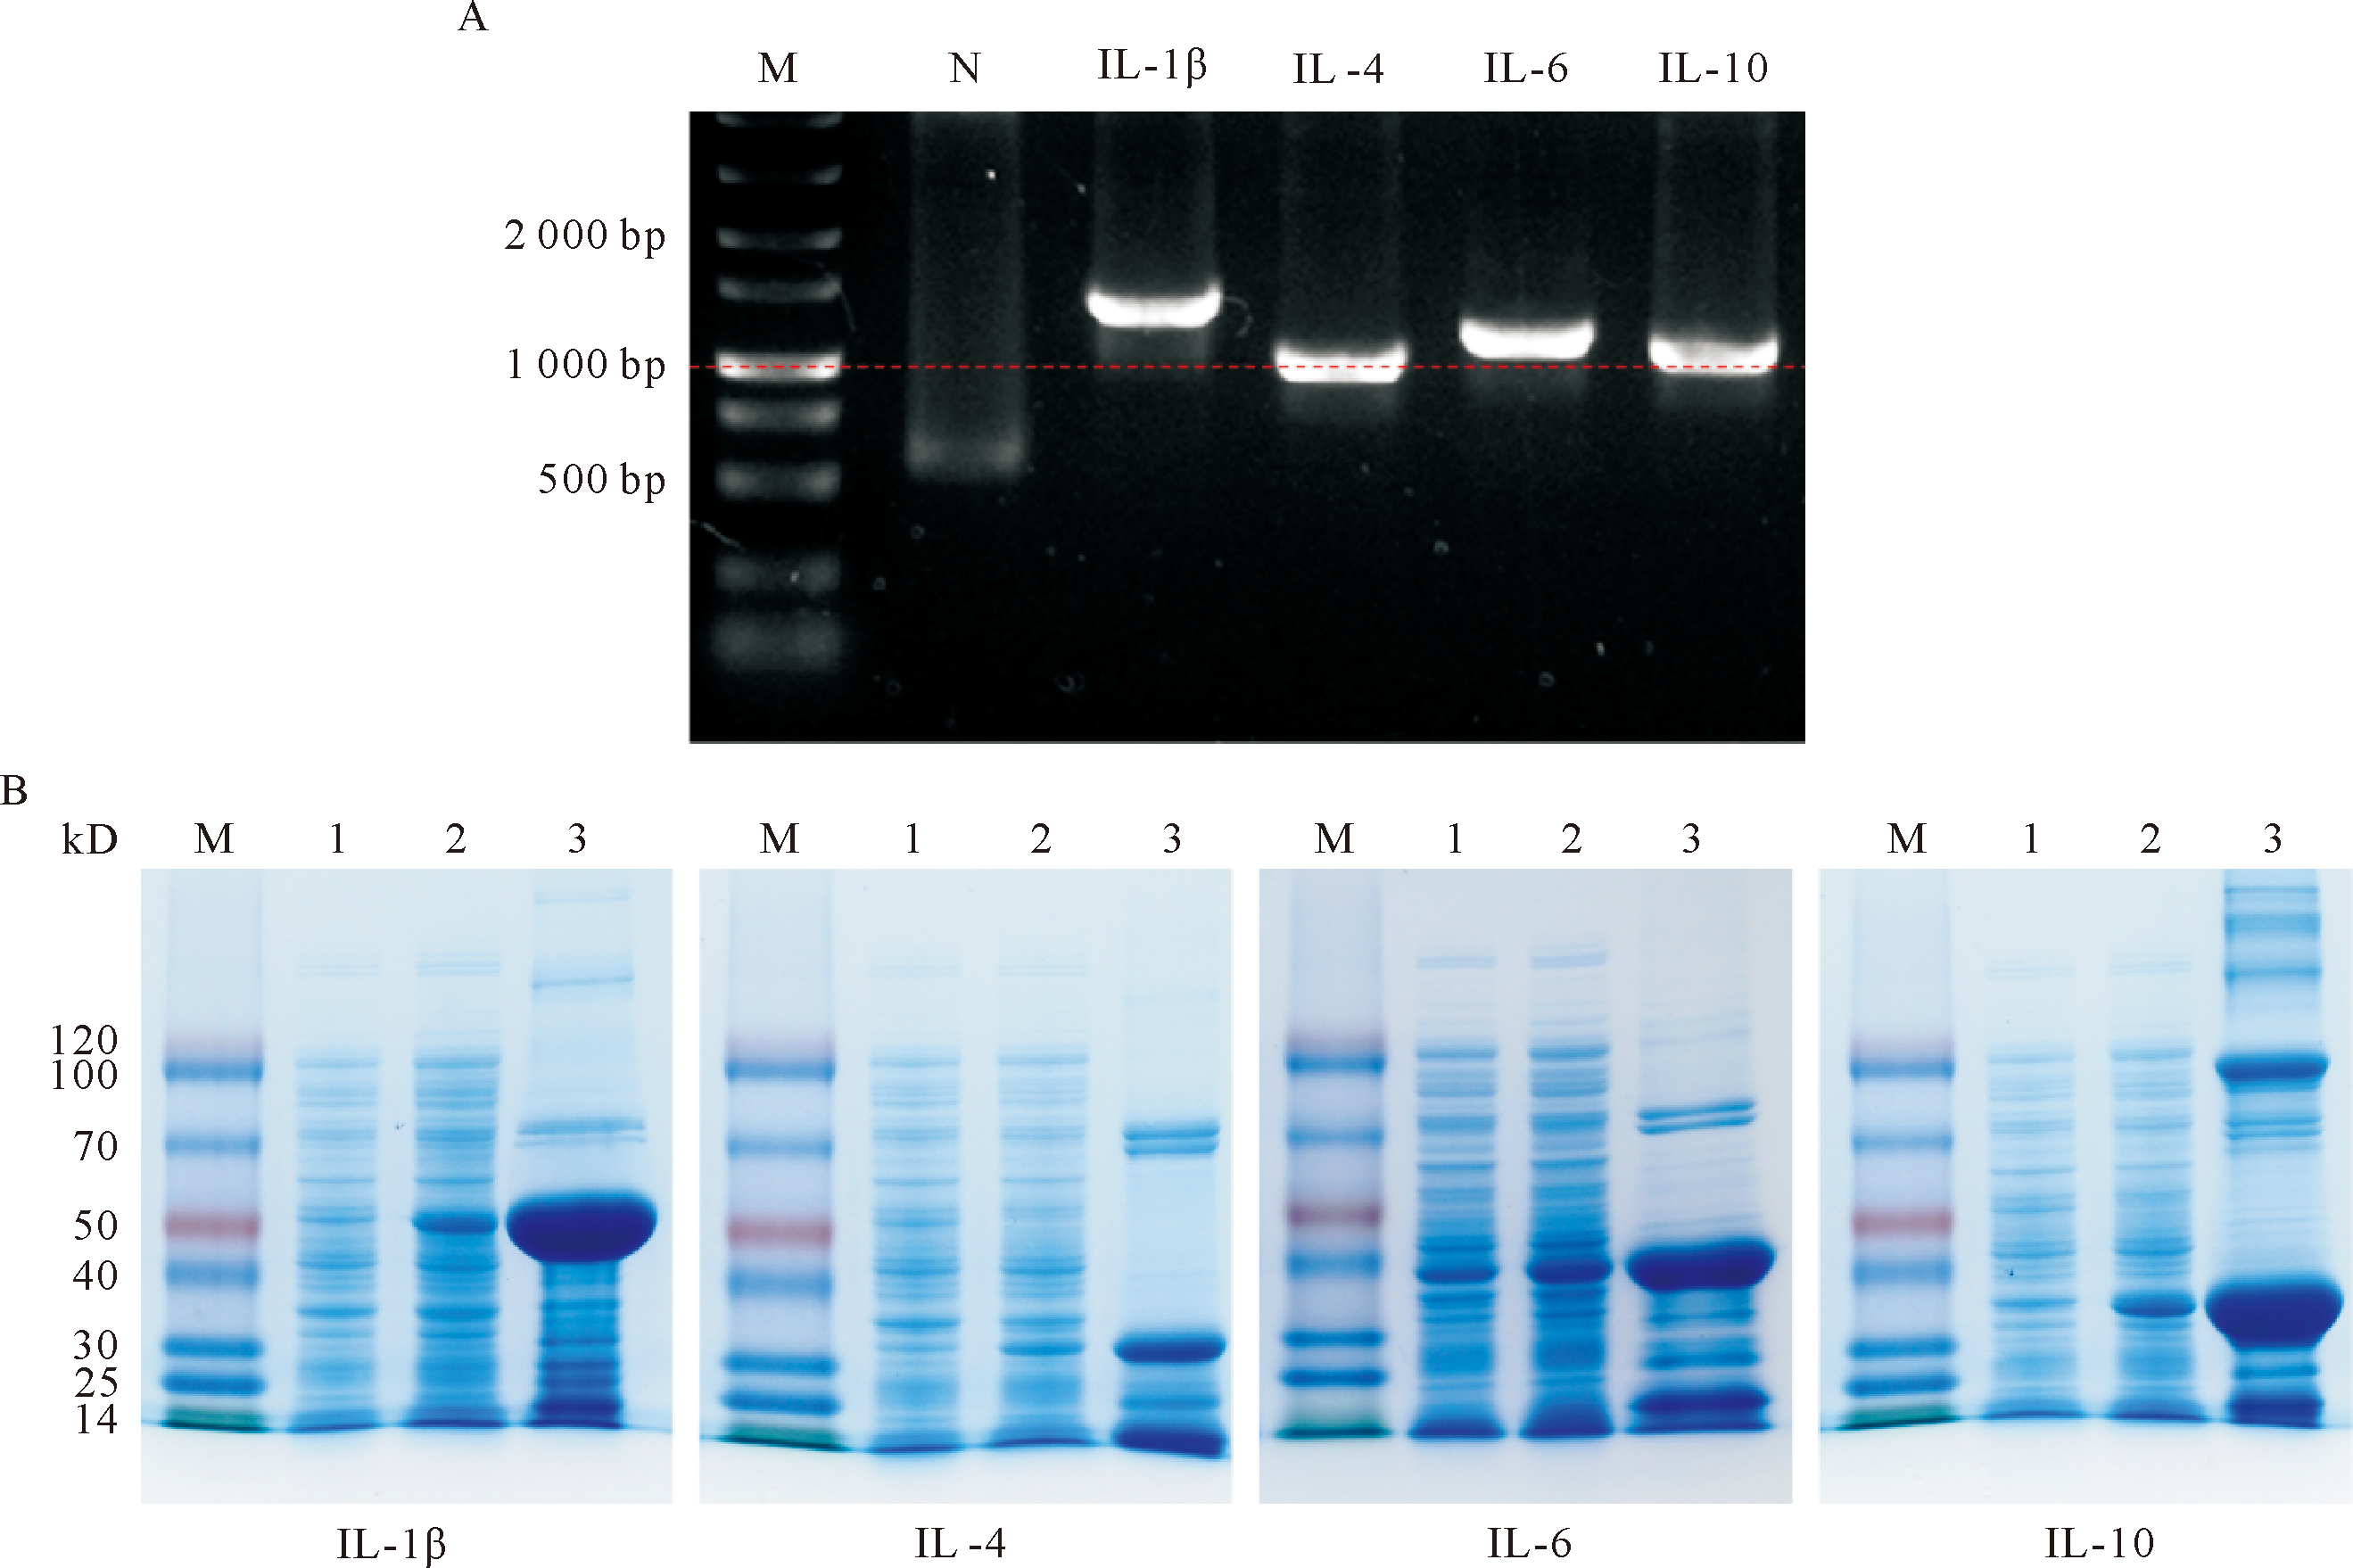
Figure 1 Identification of target gene prokaryotic expression A: PCR identification of prokaryotic expression plasmid. The lanes were sequentially DNA Marker, plasmid PCR products without inserting the target gene, and recombinant plasmid PCR products containing IL-1β, IL-4, IL-6, and IL-10 protein coding regions; B: SDS-PAGE identification of His tag target protein. Lane 1 was the uninduced bacterial liquid, lane 2 was the induced bacterial liquid, and lane 3 was the purified protein. The molecular weights of His labeled proteins of IL-1β, IL-4, IL-6, and IL-10 were 45.07, 31.82, 38.04 and 34.84 kD.
Other figure/table from this article


 粤ICP备12087612号