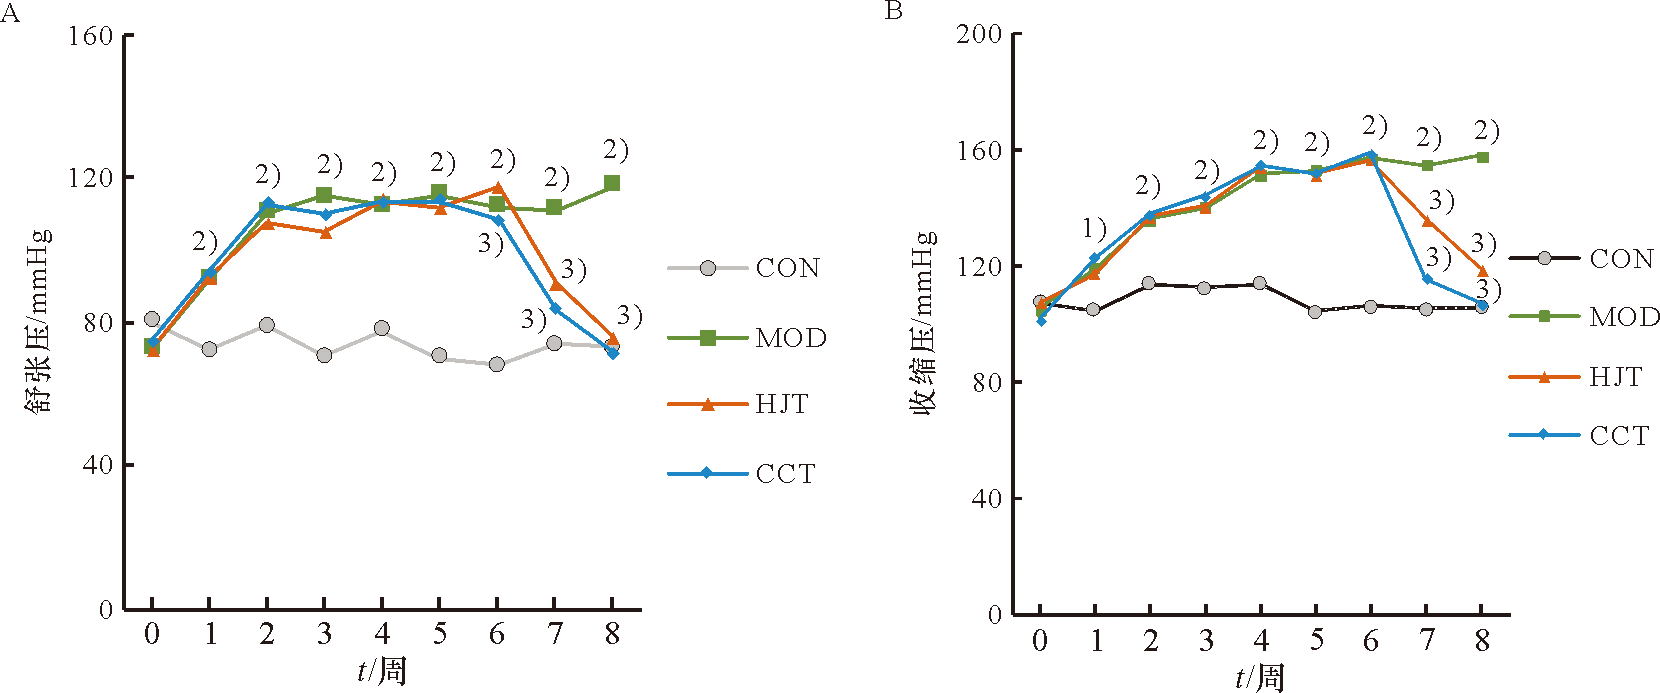
Figure 1 Changes in blood pressure of rats in each group A: Change in systolic blood pressure in each group of rats($\bar{x}±s$,n=9); B: Change in diastolic blood pressure in rats of each group($\bar{x}±s$, n=9). 1)Compared with CON group, P<0.05; 2)Compared with CON group, P<0.01;3)Compared with model group, P<0.01.
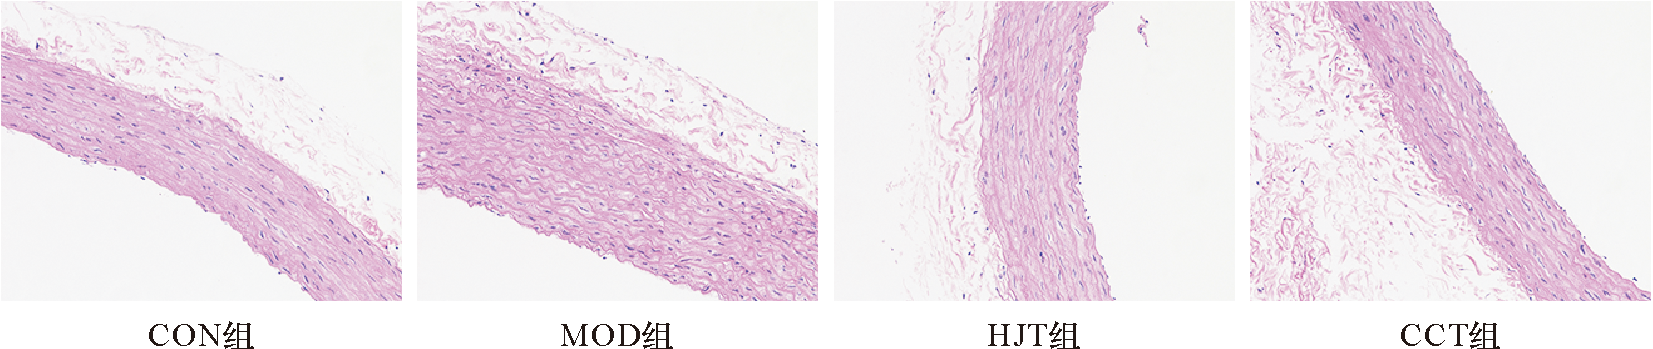
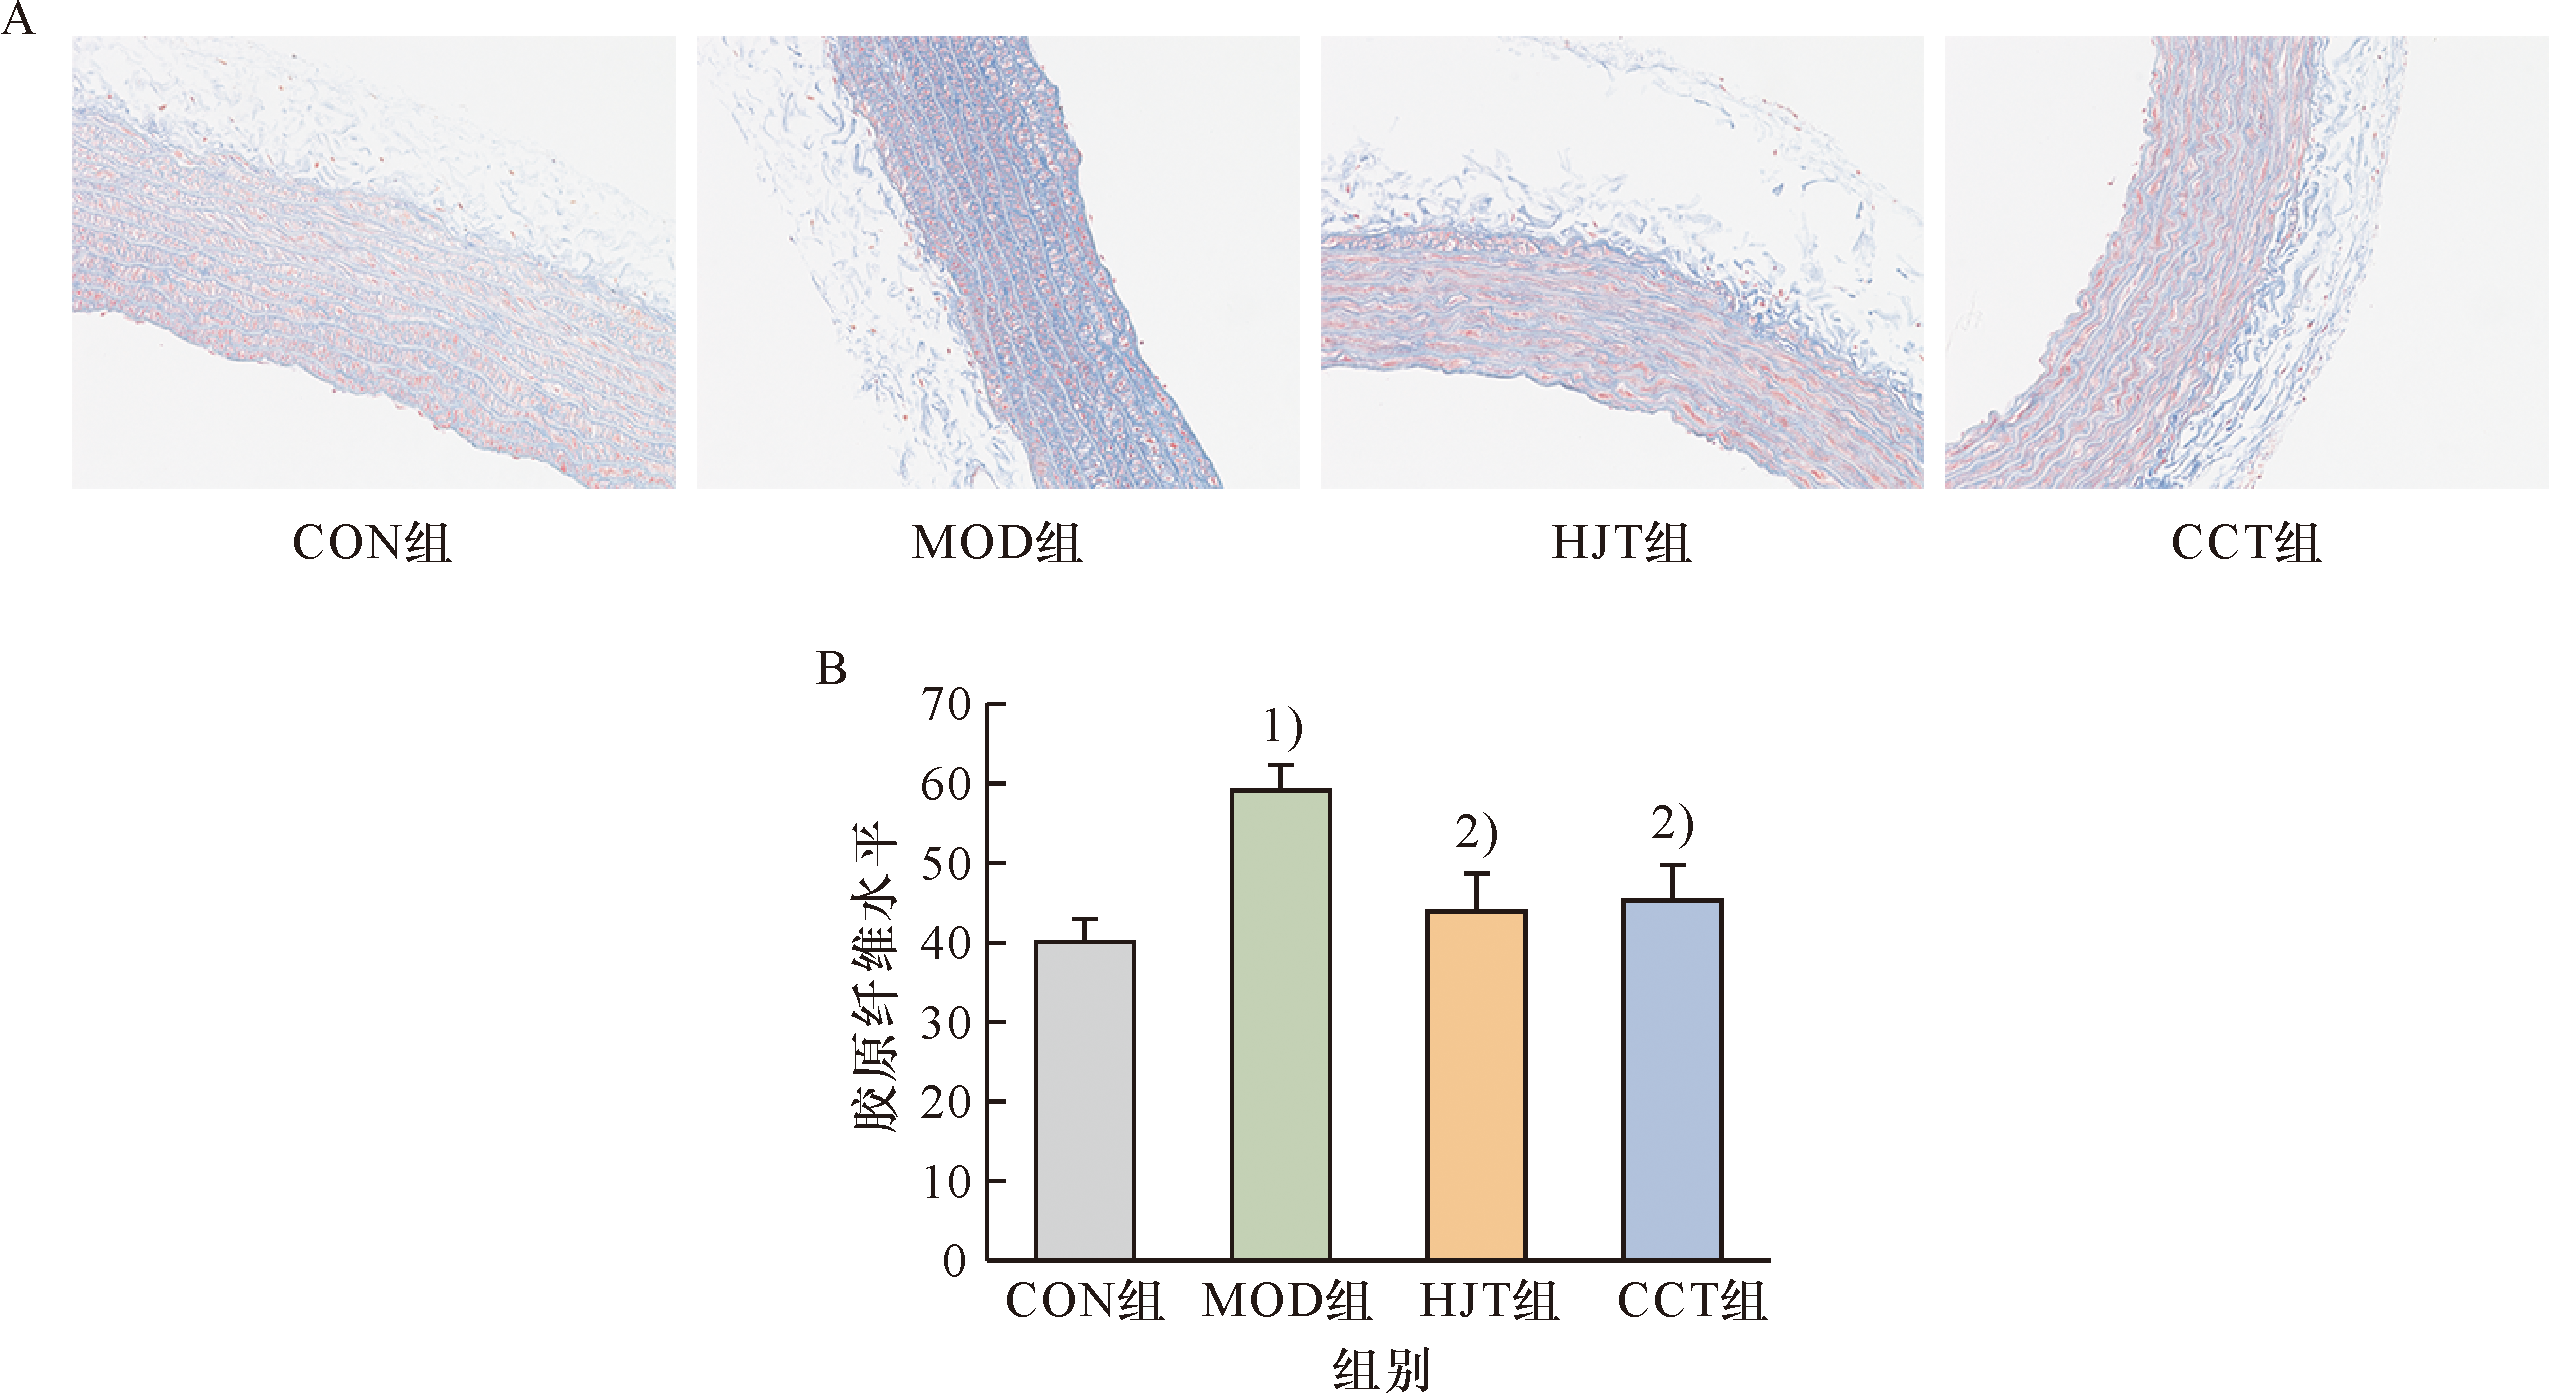
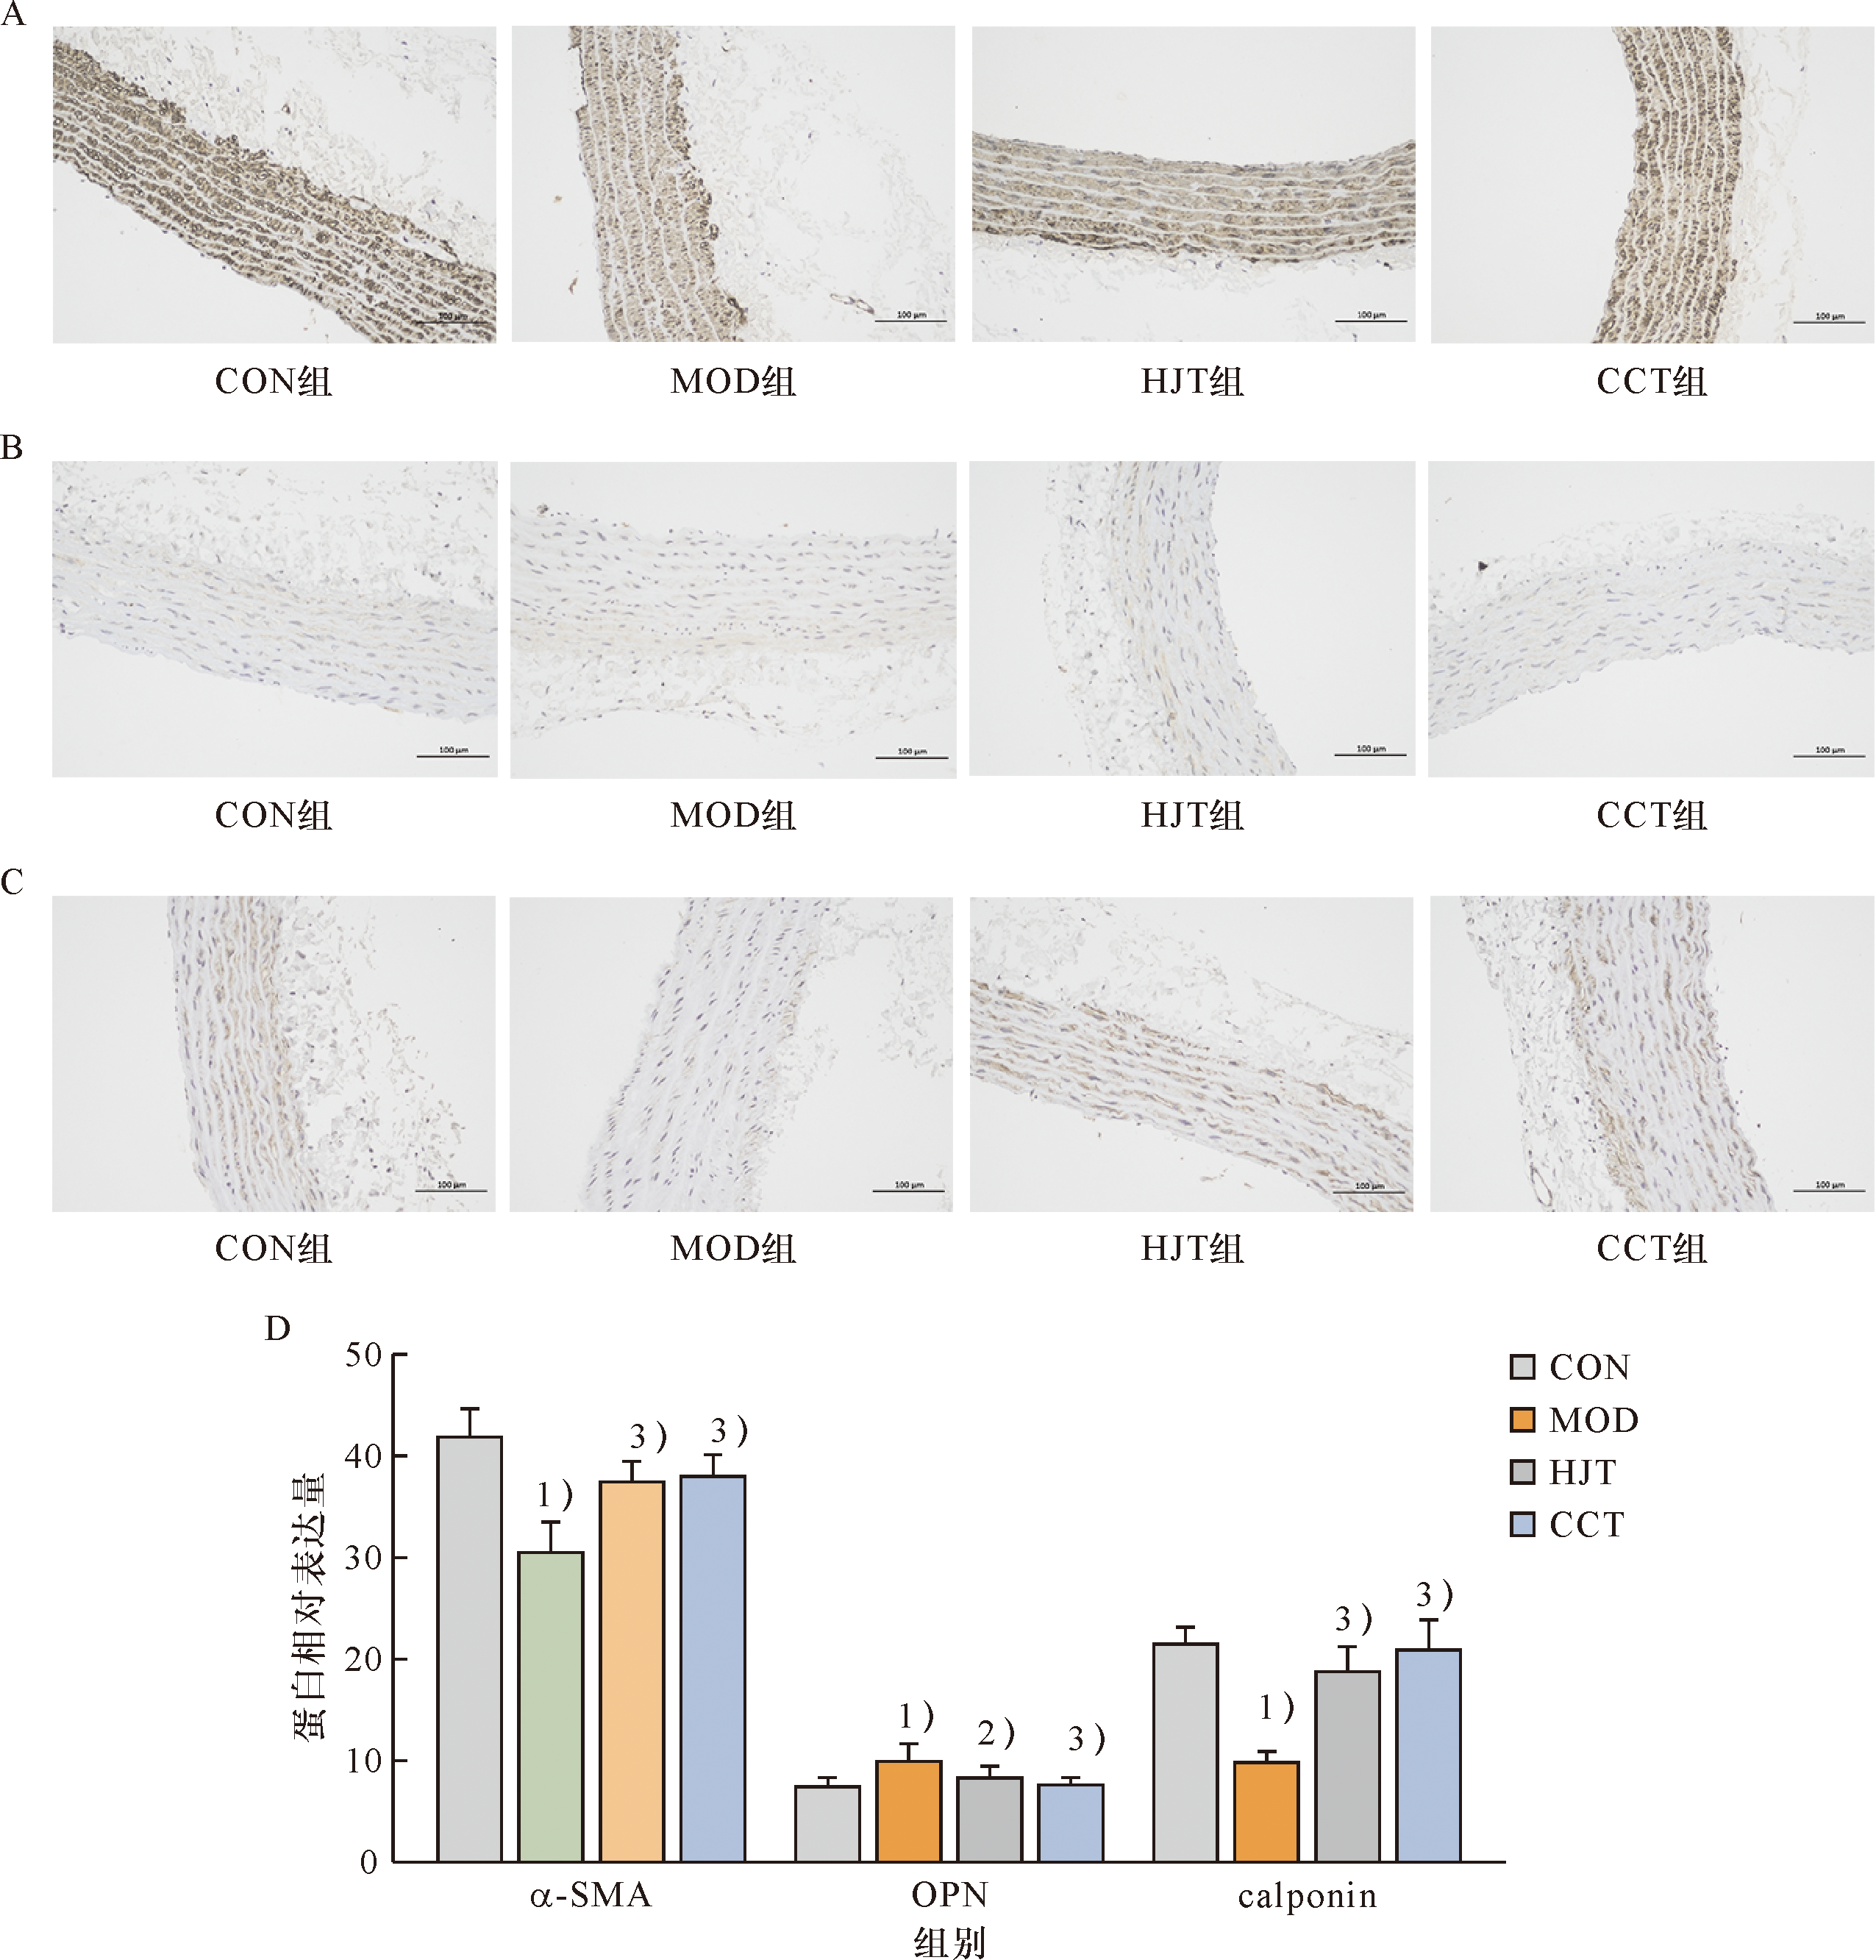
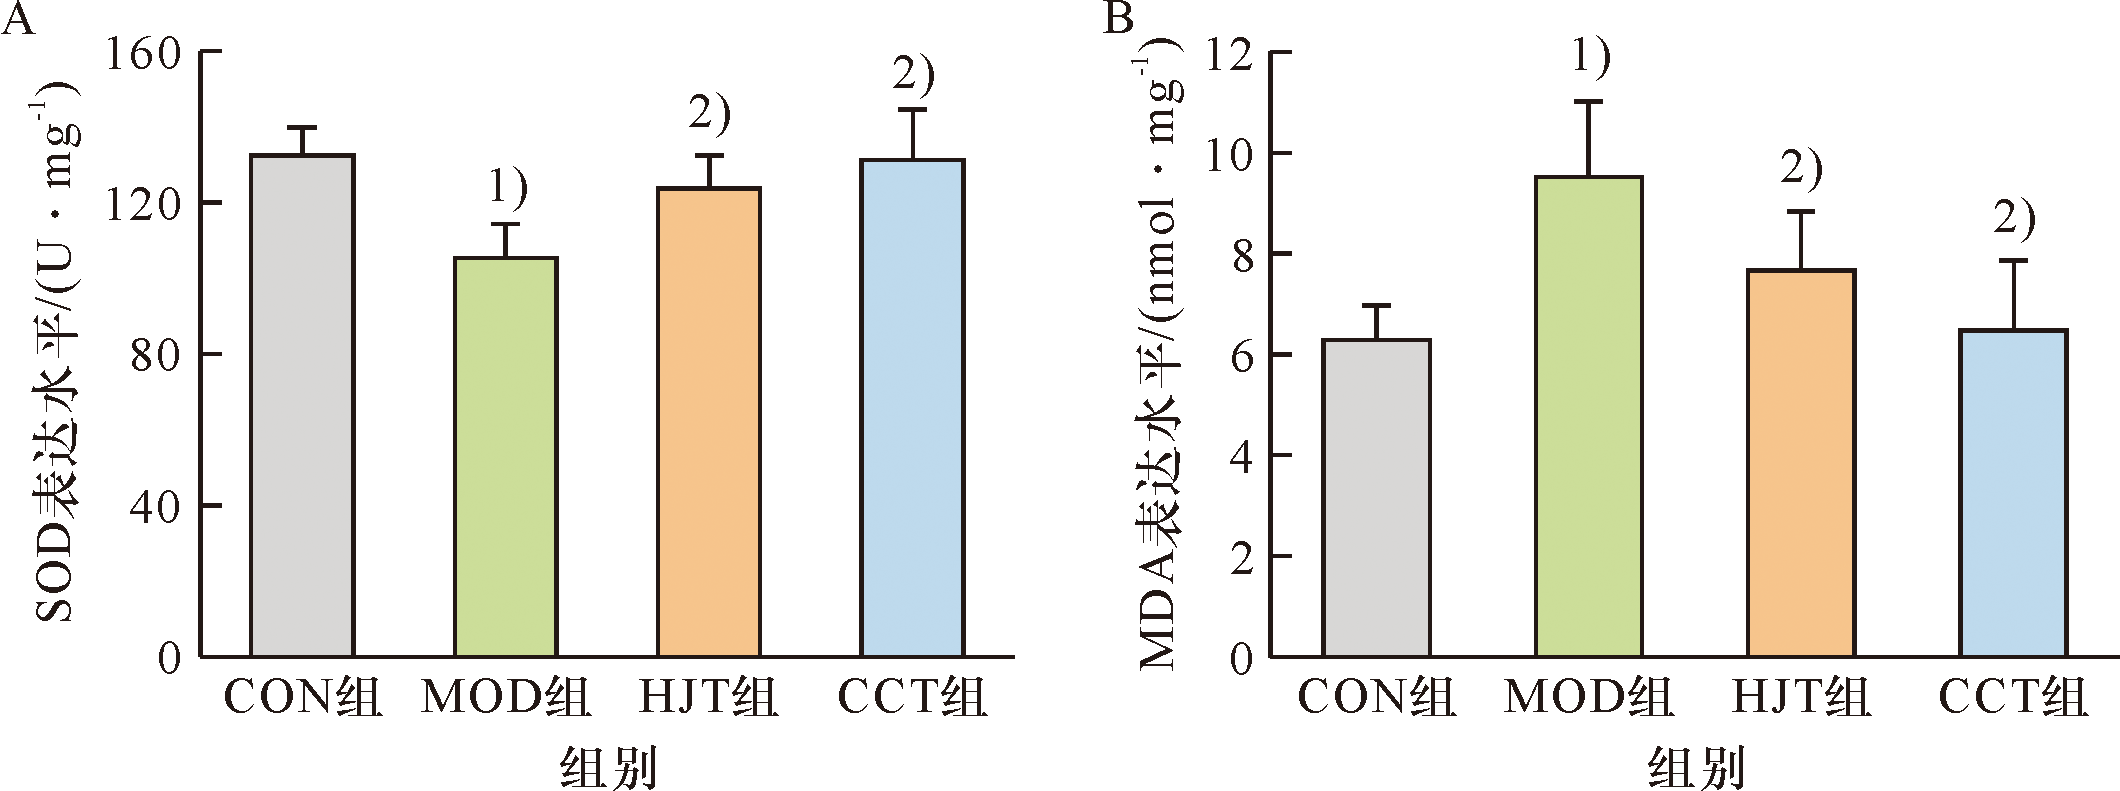
Other figure/table from this article


 粤ICP备12087612号