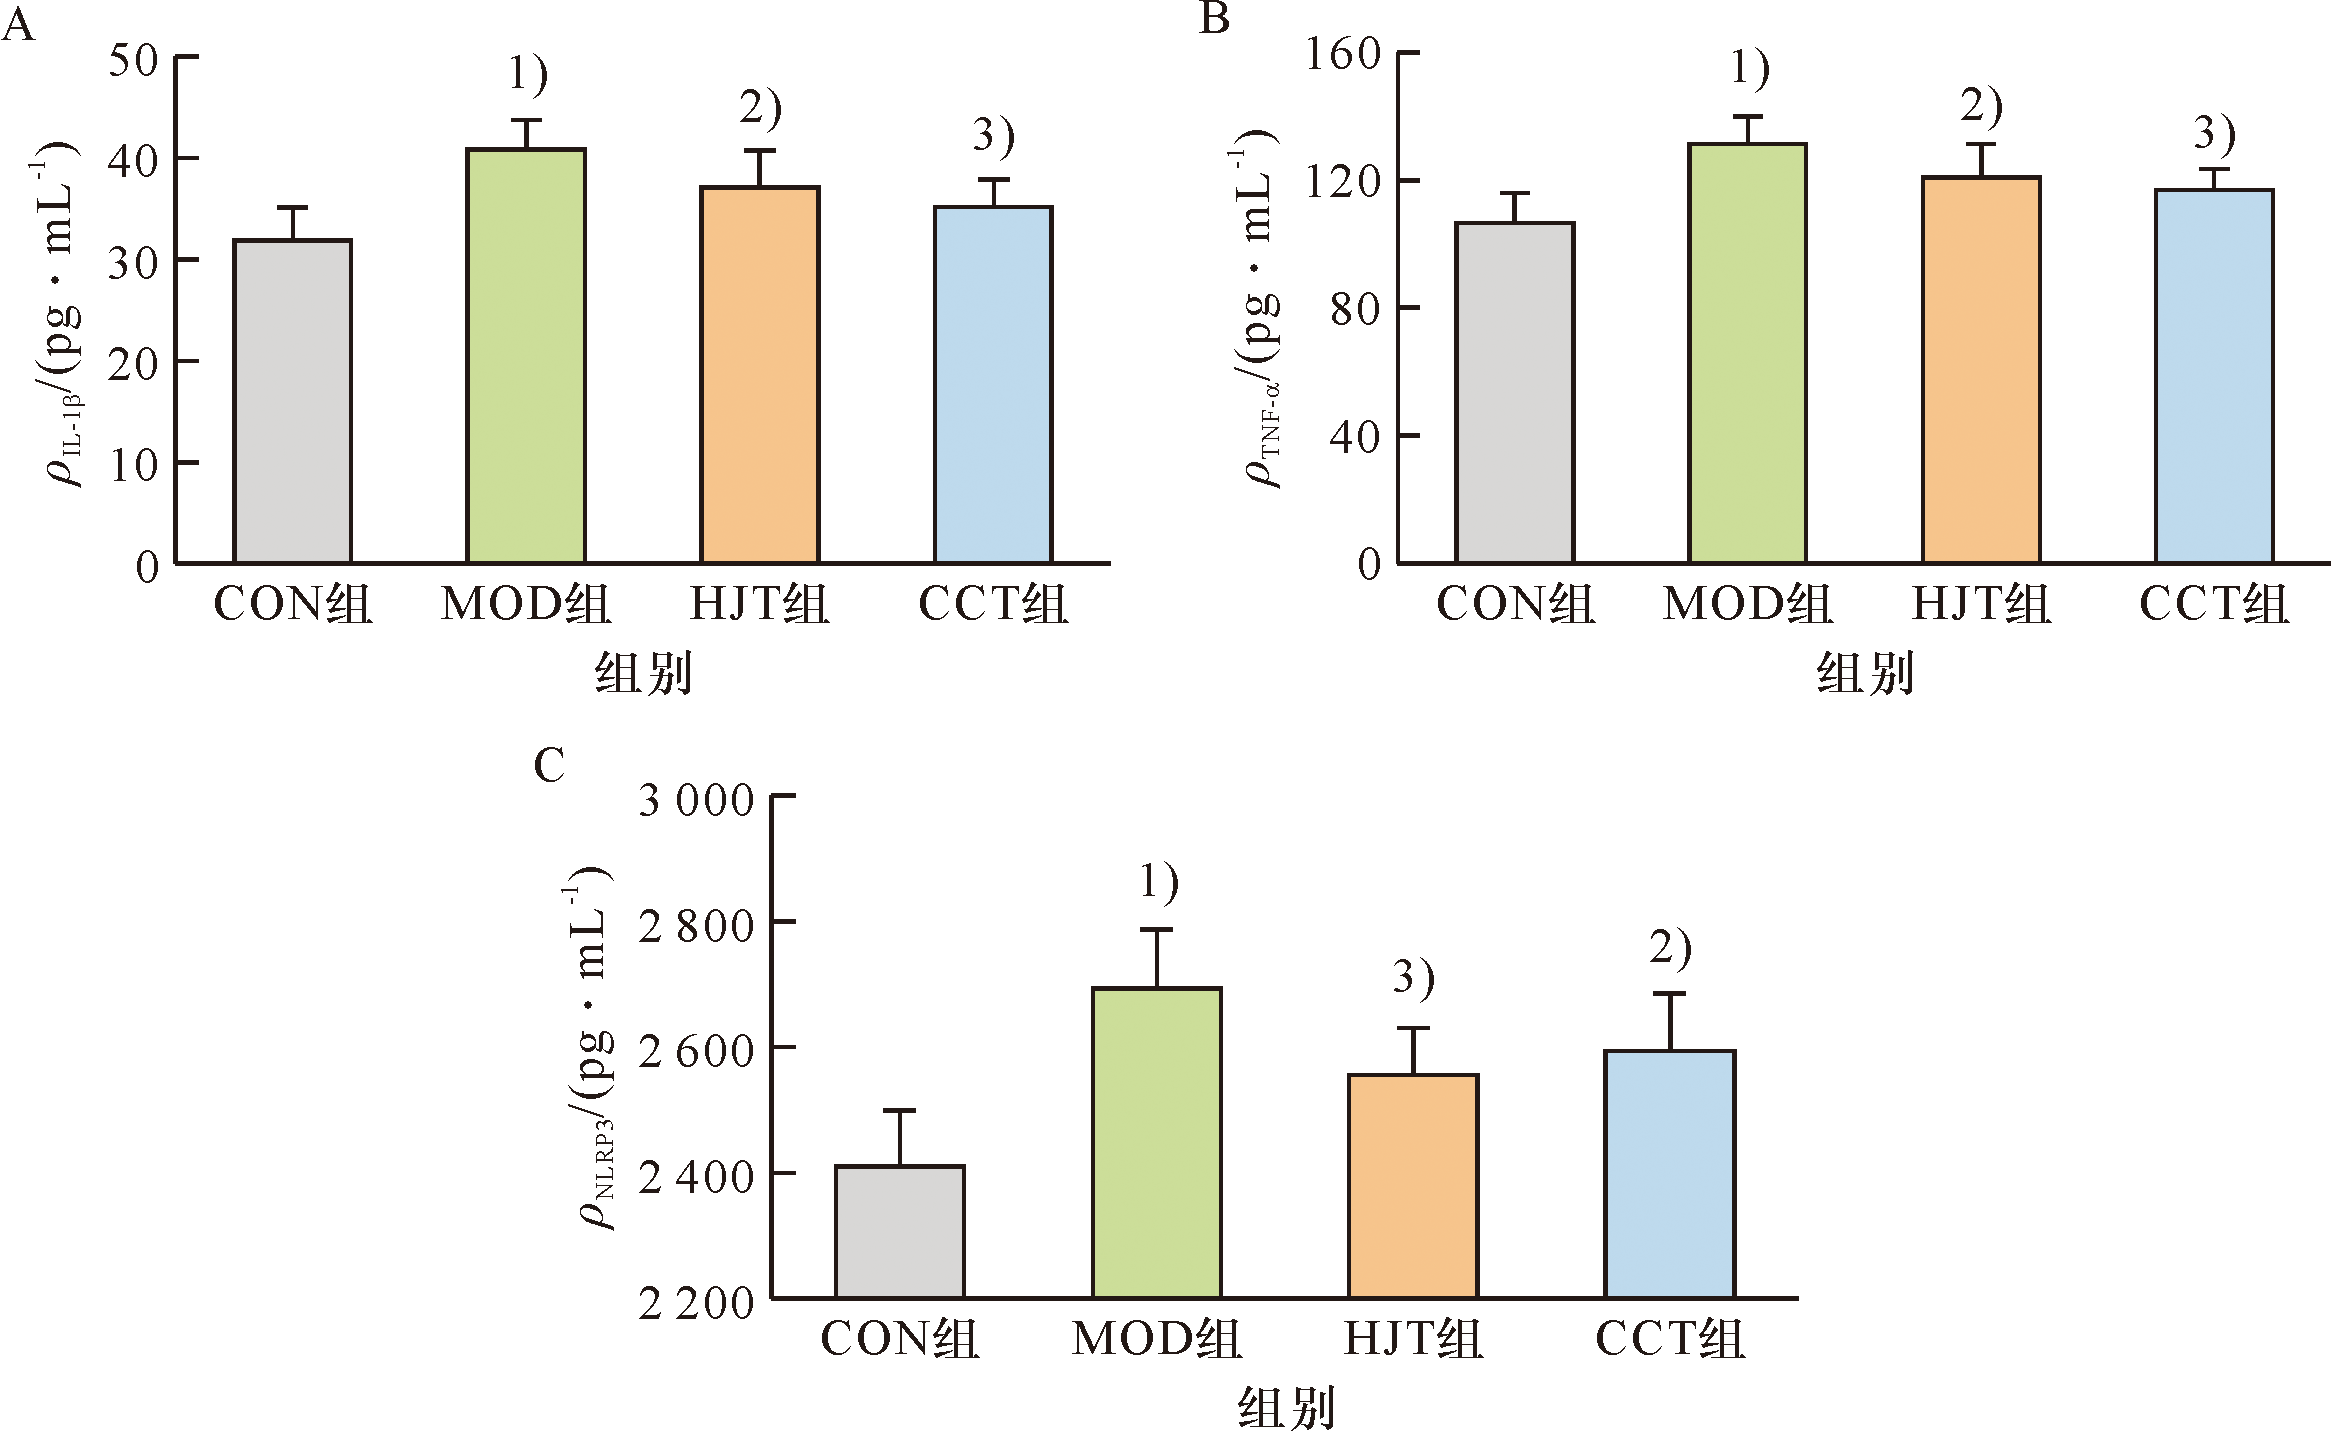
Figure 1 Changes in blood pressure of rats in each group A: Change in systolic blood pressure in each group of rats($\bar{x}±s$,n=9); B: Change in diastolic blood pressure in rats of each group($\bar{x}±s$, n=9). 1)Compared with CON group, P<0.05; 2)Compared with CON group, P<0.01;3)Compared with model group, P<0.01.
Figure 4 Comparison of the protein levels of α-SMA,OPN,and calponin in the rat aorta A:Immunohistochemistry assay result of α-SMA in rat aorta of each group(×200);B:Immunohistochemistry assay result of OPN in rat aorta of each group (×200);C:Immunohistochemistry assay result of calponin in rat aorta of each group (×200);D:Expression of α-SMA, OPN and calponin protein levels in rat aorta of each group.1)Compared with CON group,P<0.01;2)Compared with MOD group,P<0.05;3)Compared with MOD group,P<0.01.
Figure 7 Expression of Nrf2, NQO1, NF-κB and IκBα proteins in rat aortic tissues of each group analyzed by Western blot A: Band diagram of protein expression in rat aorta of each group;B: Relative protein expression in rat aorta of each group.1)Compared with CON group,P<0.01;2)Compared with MOD group,P<0.05;3)Compared with MOD group,P<0.01.