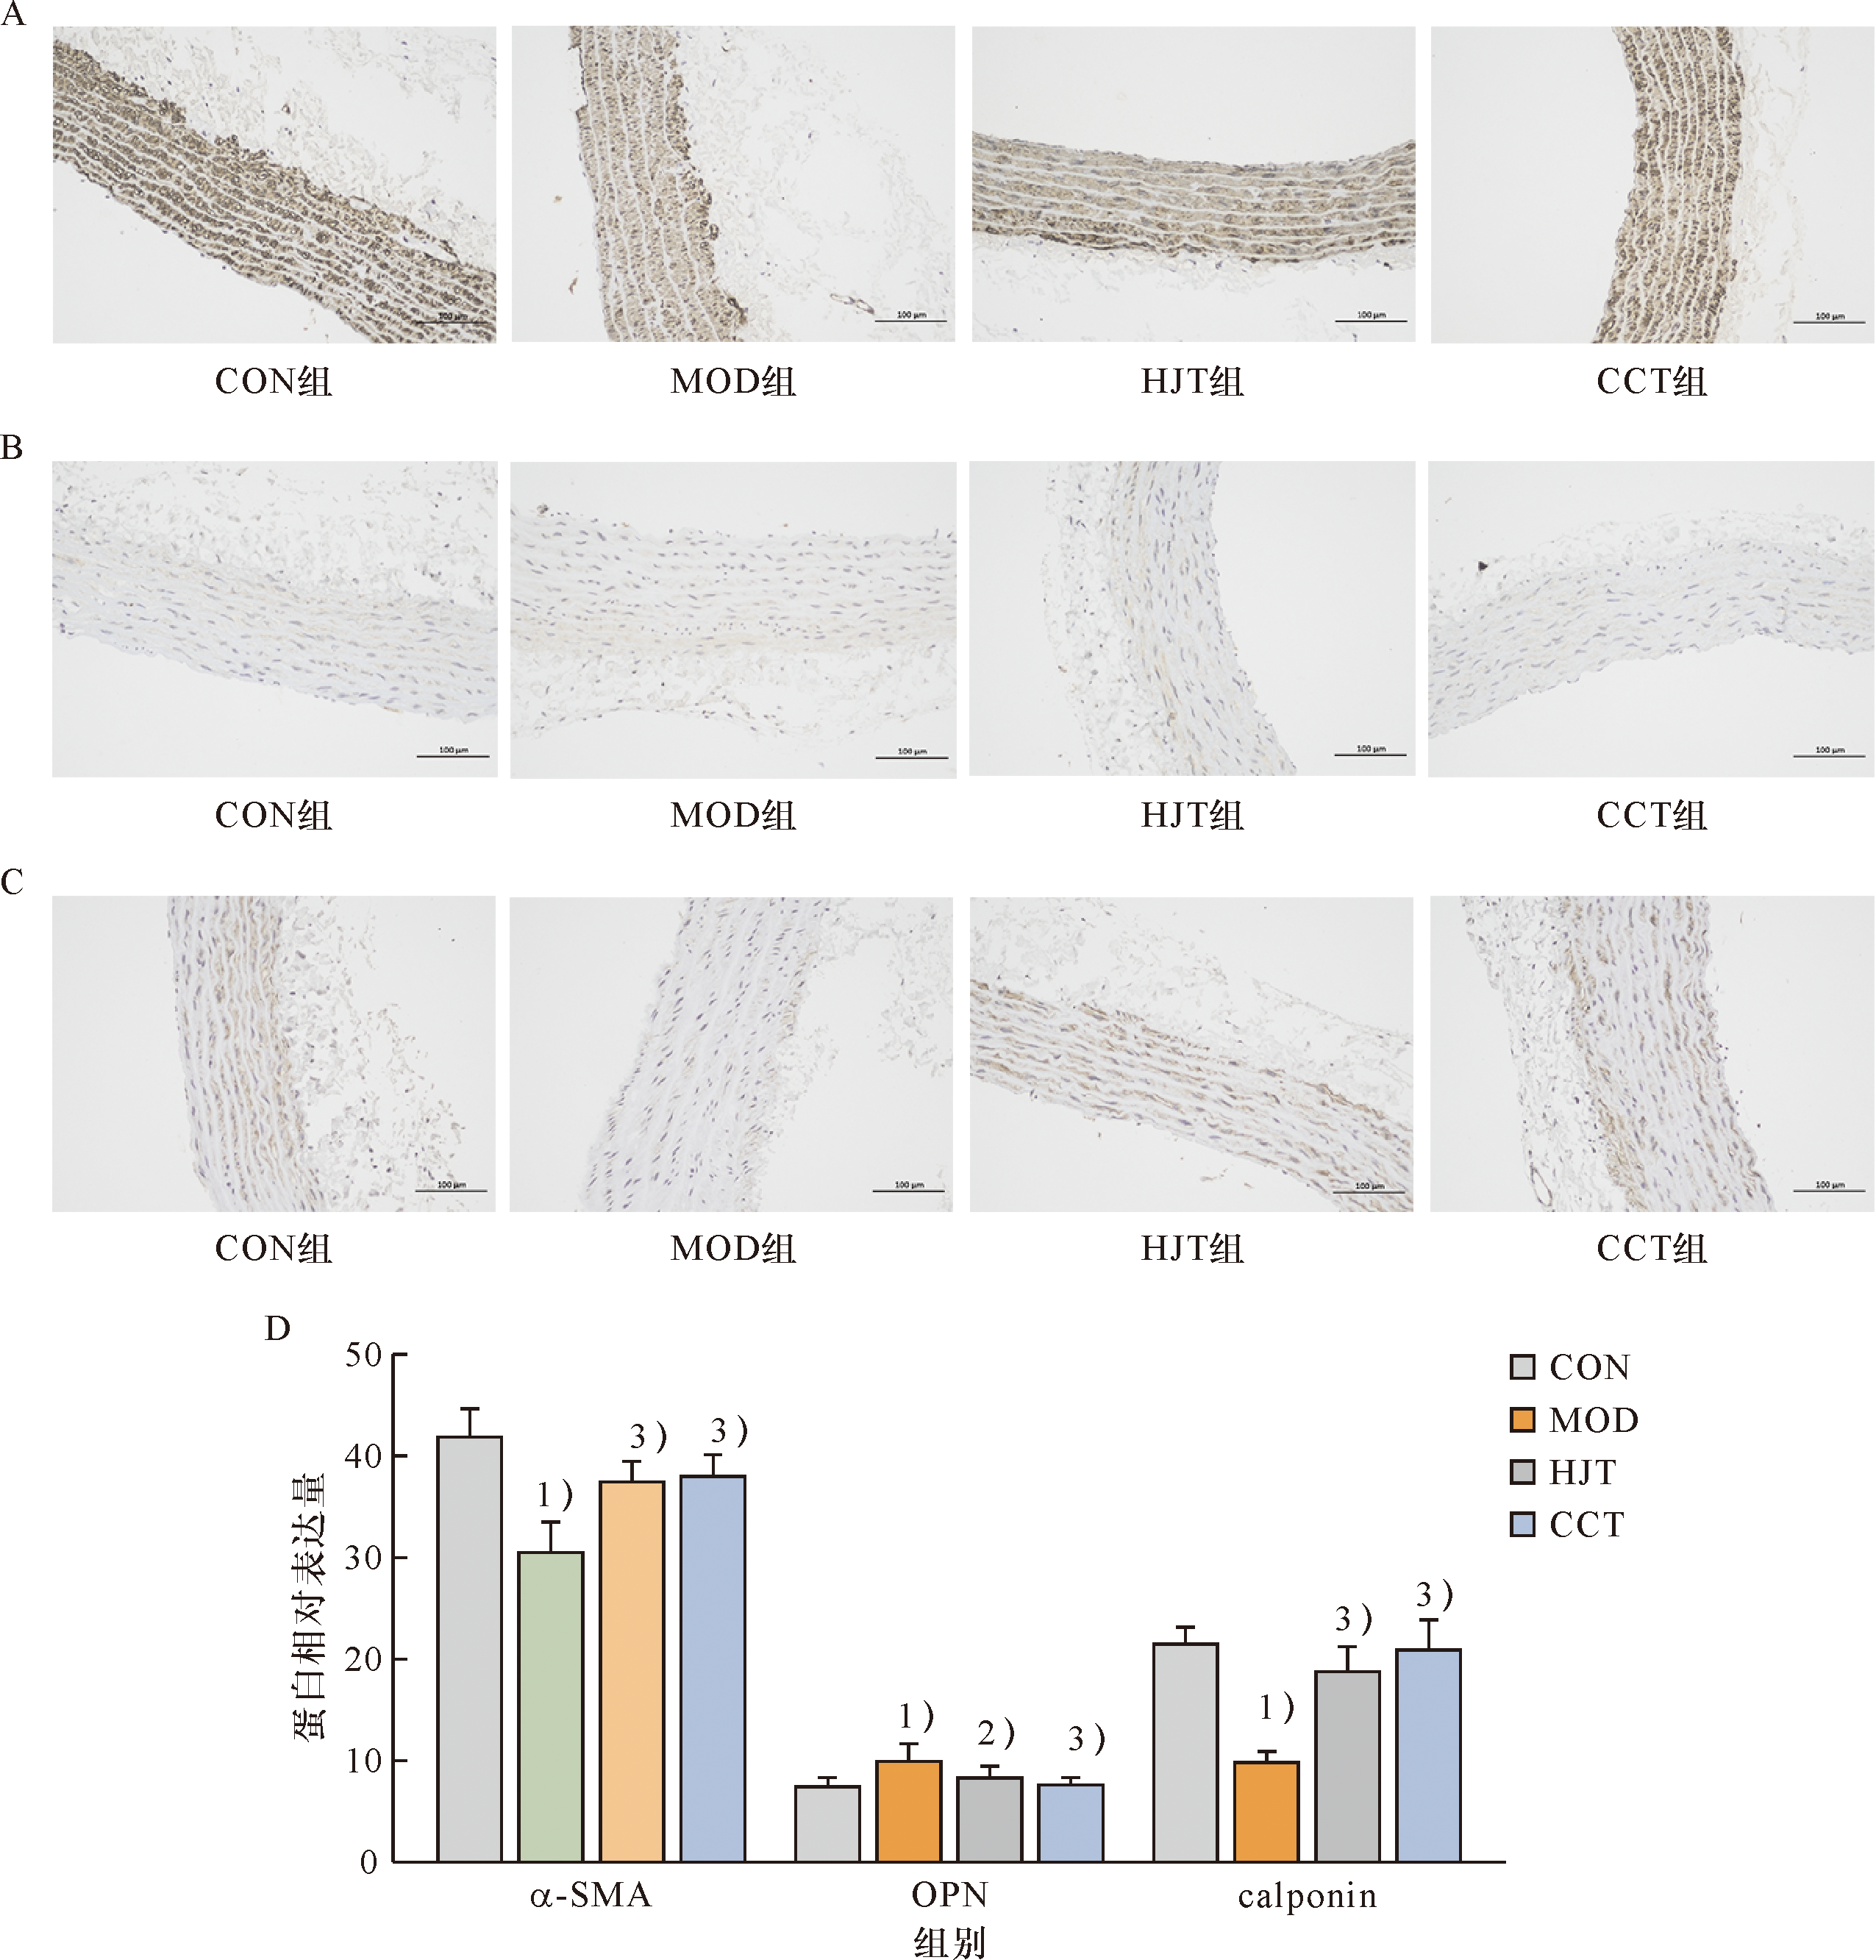
Figure 4 Comparison of the protein levels of α-SMA,OPN,and calponin in the rat aorta A:Immunohistochemistry assay result of α-SMA in rat aorta of each group(×200);B:Immunohistochemistry assay result of OPN in rat aorta of each group (×200);C:Immunohistochemistry assay result of calponin in rat aorta of each group (×200);D:Expression of α-SMA, OPN and calponin protein levels in rat aorta of each group.1)Compared with CON group,P<0.01;2)Compared with MOD group,P<0.05;3)Compared with MOD group,P<0.01.
Other figure/table from this article


 粤ICP备12087612号